The H-R Diagram
This lesson covers:
- The origins and purpose of the Hertzsprung-Russell diagram
- How absolute magnitude and temperature are plotted on the diagram
- Identifying the main sequence, red giants, and white dwarfs
- The significance of a star's position on the diagram
- Linking a star's position to its current stage of evolution
The origins of the Hertzsprung-Russell diagram
The Hertzsprung-Russell diagram, often abbreviated as the H-R diagram, was independently developed by two astronomers, Ejnar Hertzsprung and Henry Norris Russell, in the early 20th century.
Their work involved plotting stars according to their absolute magnitude (a measure of intrinsic brightness) against their temperature. This innovative approach revealed distinct patterns and groupings among stars, providing a powerful visual tool for understanding their properties, classification, and evolutionary stages. The diagram has since become a cornerstone of astrophysics, offering insights into the lifecycle of stars based on their position within it.
Variables plotted on H-R diagram axes
The axes of the Hertzsprung-Russell diagram represent two fundamental stellar properties:
Y-axis: Absolute magnitude
- A logarithmic measure of a star's intrinsic brightness.
- Calculated from the star's apparent magnitude and distance.
- Lower value indicates greater brightness.
X-axis: Temperature
- Decreases from left to right.
- Can be measured directly or via spectral type categories.
- Hotter stars emit shorter wavelength radiation.
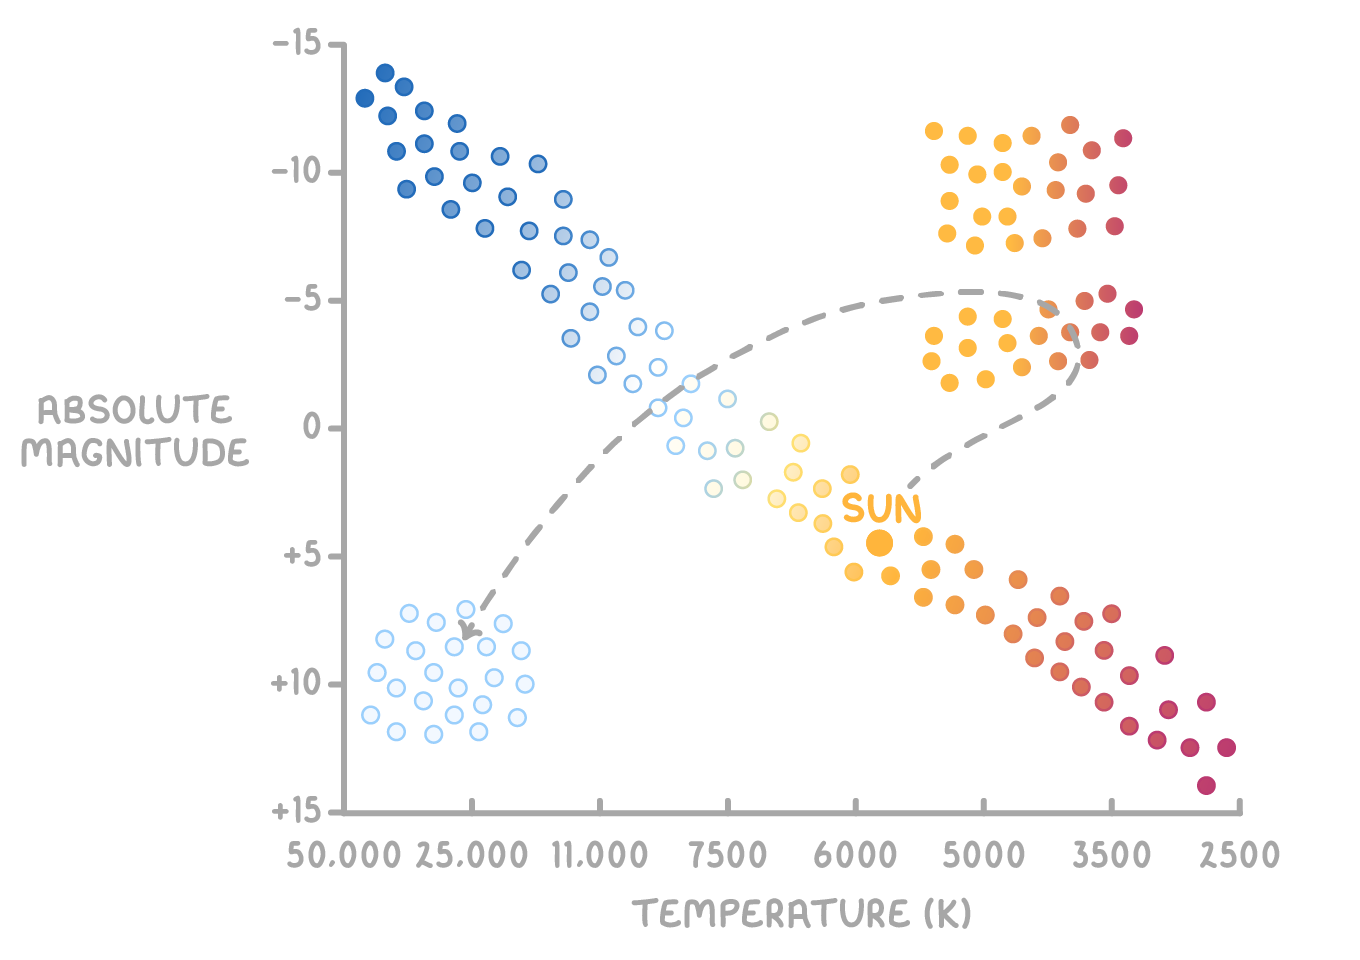
Identifying key areas on the H-R diagram
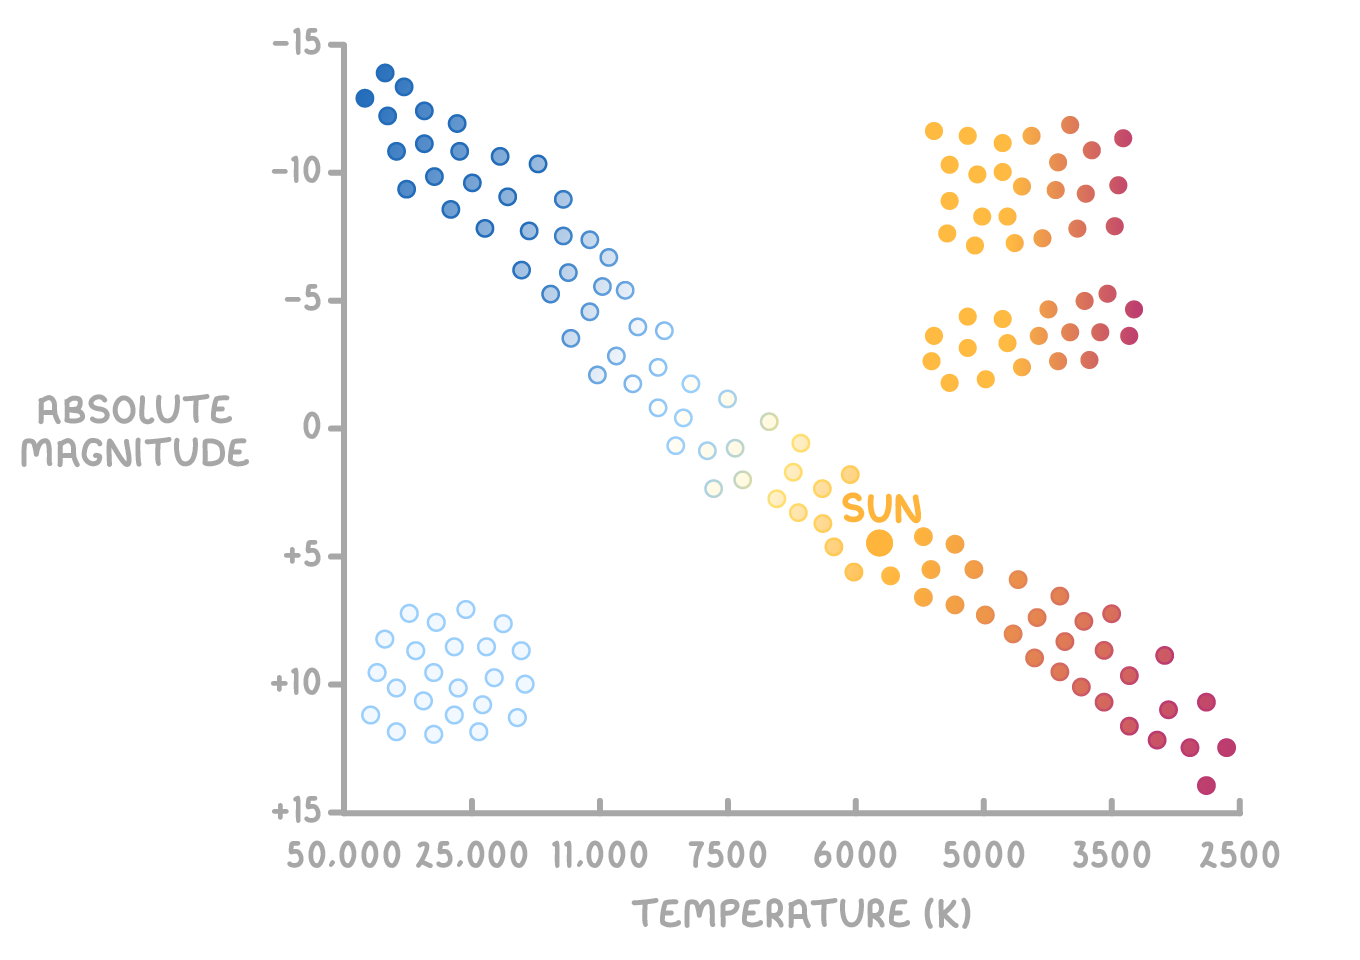
Three primary regions on the H-R diagram highlight major stages in stellar evolution:
The Main Sequence
- A broad diagonal strip running from the upper left (hot, bright stars) to the lower right (cool, dim stars). Stars spend the majority of their lifespans in the main sequence stage, where they fuse hydrogen into helium in their cores in a stable manner.
Red Giants
- Positioned in the upper right section, these are stars that have exhausted the hydrogen in their cores and expanded significantly, cooling their surfaces but increasing their overall luminosity due to their large size. This stage marks a period of helium fusion.
White Dwarfs
- Found in the lower left corner, white dwarfs are the remnants of stars that have ceased nuclear fusion. Despite their high temperatures, their small size results in low luminosity. They are supported against gravity by electron degeneracy pressure, not fusion.
Relating a star's position to its evolution
A star's journey across the H-R diagram reflects its evolutionary path:
- Main Sequence Lifetime - Characterised by stable hydrogen fusion in the core.
- Red Giant Phase - The star expands and cools on the surface while fusing helium into heavier elements in the core.
- White Dwarf Stage - The final stage of a star's life, marked by the cessation of nuclear fusion and a gradual cooling process.
By observing a star's movement across the diagram, astronomers can deduce its current stage of evolution and predict its future trajectory. The H-R diagram serves as a map, guiding our understanding of the complex lifecycle of stars.