Motion Graphs
This lesson covers:
- Features of a displacement-time graph
- acceleration on a displacement-time graph
- Learning to calculate velocity from the gradient of a displacement-time graph
- Features of a velocity-time graph
- Acceleration from a velocity-time graph
- Calculating displacement from area under velocity-time graph
Displacement-time graphs
Displacement-time graphs show how far an object has moved from its starting point (displacement) and the time it took to move that distance.
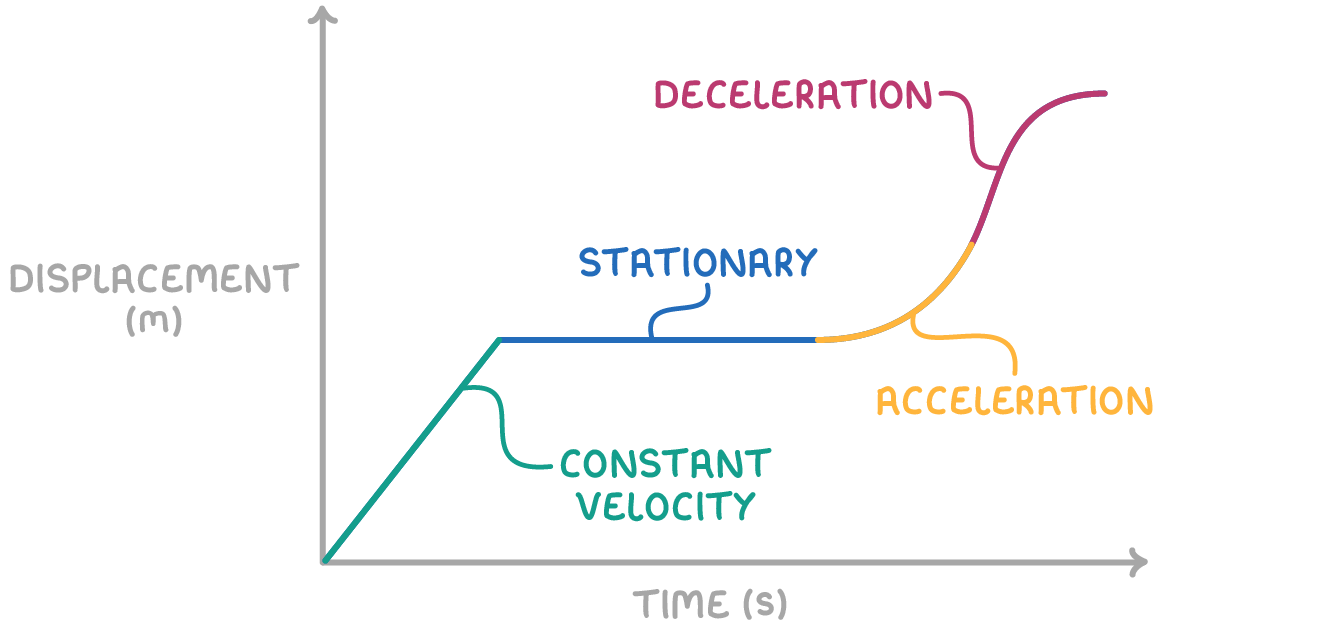
Key features include:
- Y-axis represents displacement: The vertical axis shows the distance from the start point, in meters.
- X-axis represents time: The horizontal axis indicates the time, usually in seconds.
- Shape of the graph: A straight horizontal line indicates no movement, a straight sloping line indicates constant speed, and a curve shows changing speed (acceleration or deceleration).
When an object accelerates, its speed changes over time. Acceleration appears as a curved line on a displacement-time graph.
If the acceleration is constant, meaning it doesn't change, the curve on the graph will be smooth and regular. This shows that the speed of the object is increasing at a steady rate.
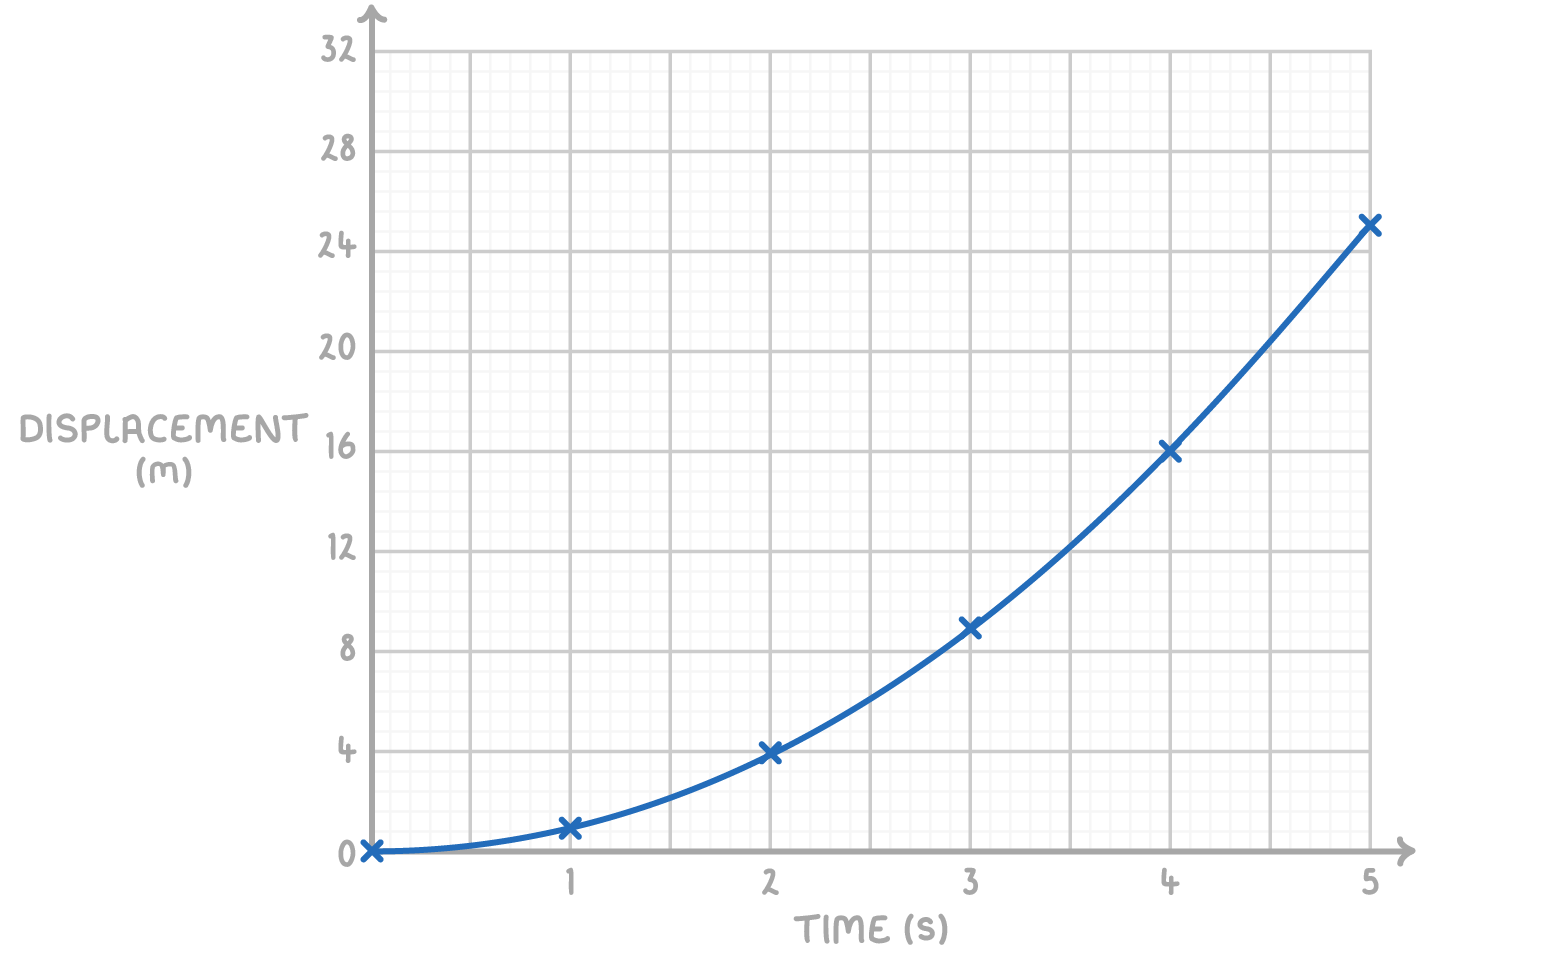
Worked example: Acceleration on a displacement-time graph
Consider a lion that starts from rest and accelerates at a constant rate of 2 m s-2 for 5 seconds. We'll plot this on a displacement-time graph:
Step 1: Identify the known values
- Initial velocity (u) = 0 m/s (because it starts from rest)
- Acceleration (a) = 2 m/s²
- Time (t) ranges from 0 to 5 seconds
Step 2: Calculate displacement using the formula
s = u t + 21a t2
s = 0 × t + 21×2 × t2
Step 3: Complete the table of time and displacement values
| Time (t) in seconds | Displacement (m) |
|---|---|
| 0 | 0 |
| 1 | 1 |
| 2 | 4 |
| 3 | 9 |
| 4 | 16 |
| 5 | 25 |
Step 4: Plot the displacement-time graph
The gradient of a displacement-time graph is velocity
Velocity can be calculated by dividing the change in displacement by the change in time. On a graph, this calculation is represented by the gradient, which is calculated as:
gradient = ΔxΔy=change in timechange in displacement
For graphs that show acceleration, this gradient is not constant; it changes along the curve.
Determining instantaneous velocity
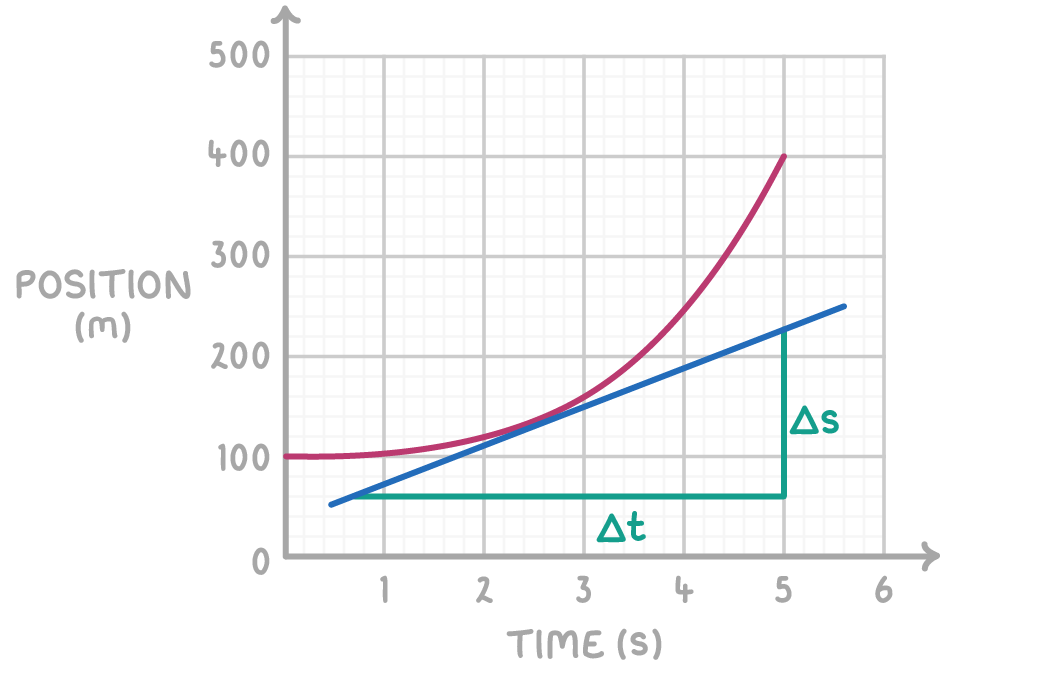
To find the velocity at a specific moment in time on a curved graph:
- Draw a tangent line (a straight line that just touches the curve) at the chosen point in time.
- Calculate the gradient of this tangent line using the formula:
Velocity-time graphs
velocity-time graphs show how quickly an object is travelling (velocity) against time.
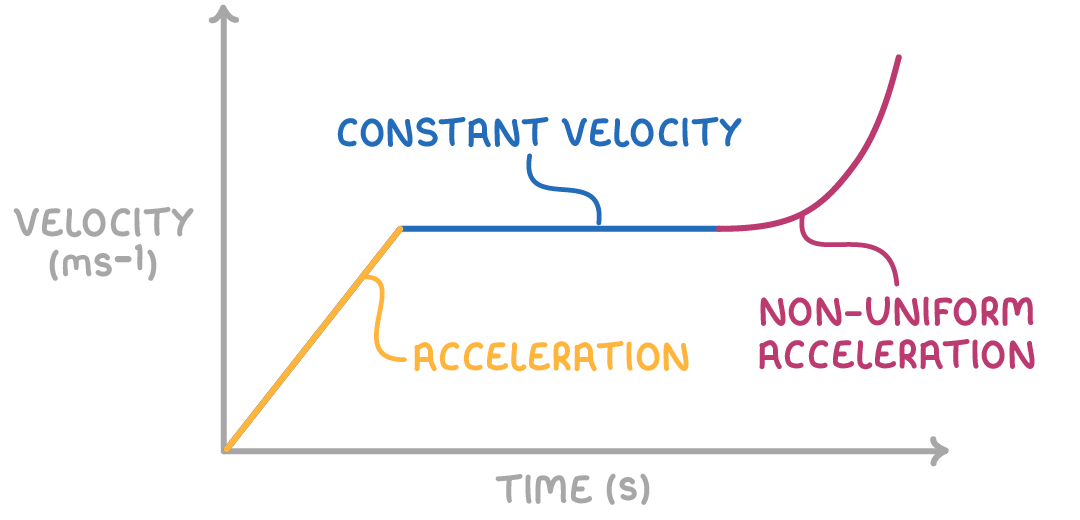
Key features include:
- Y-axis represents displacement: The vertical axis shows the velocity of the object, in meters per second.
- X-axis represents time: The horizontal axis indicates the time, usually in seconds.
- Shape of the graph: A straight horizontal line indicates constant velocity, a straight sloping line indicates constant acceleration, and a curve shows variable acceleration.
The gradient of a velocity-time graph shows acceleration.
a = ΔtΔv
Displacement from a velocity-time graph
The area underneath a velocity-time graph is equal to the displacement.

To find displacement:
- Calculate area under graph
- Count squares if gridded or use shapes
- Negative area represents backward motion