Line Emission Spectra
This lesson covers:
- Continuous spectrum of light
- Line emission spectra from gases
- Line absorption spectra
- How to compare emission and absorption spectra
Continuous spectrum of light
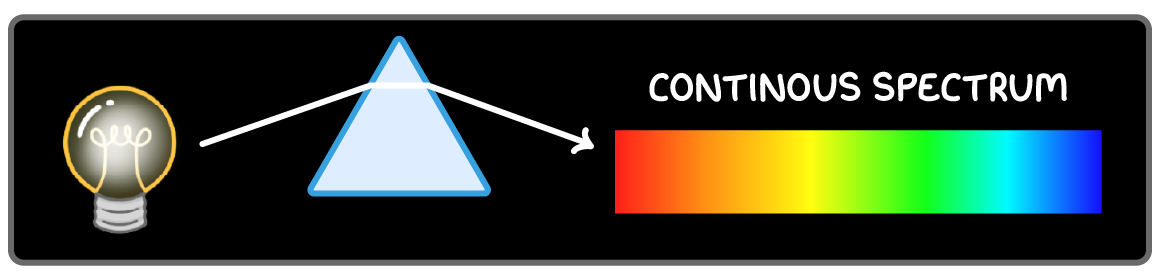
The spectrum of white light is continuous.
Hot objects emit a continuous spectrum of light in the visible and infrared region.
All wavelengths are observed because the electrons are not confined to discrete energy levels.
Passing the light through a prism allows a continuous spectrum of wavelengths to be observed.
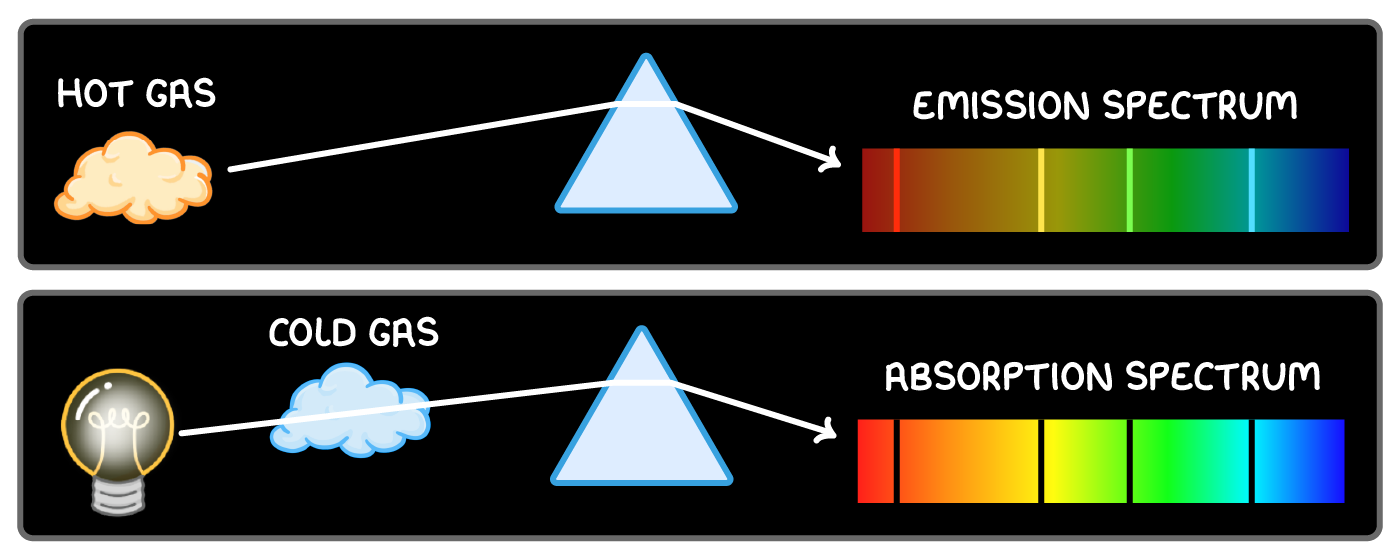
Line emission spectra
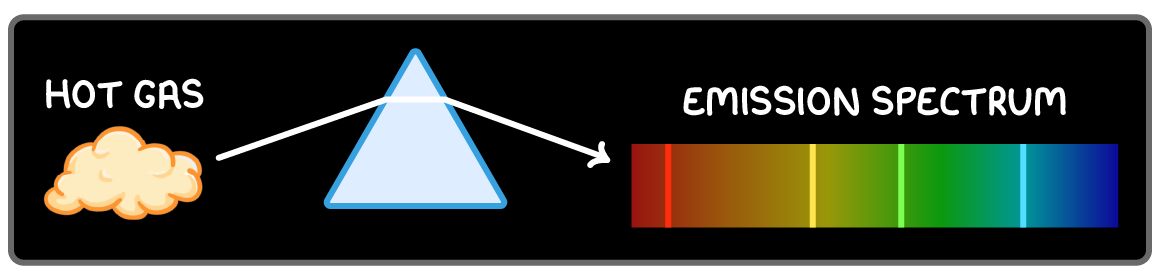
When light from excited gases passes through a prism, particular wavelengths are separated into a line emission spectrum.
Each line corresponds to a wavelength of light emitted.
This shows the discrete electron energy level transitions emitting those wavelengths in the gas.
Each element has a unique line emission spectra.
Line absorption spectra
A line absorption spectrum occurs when white light passes through a gas.
Atoms in the gas absorb particular wavelengths, leaving dark absorption lines in the continuous spectrum.
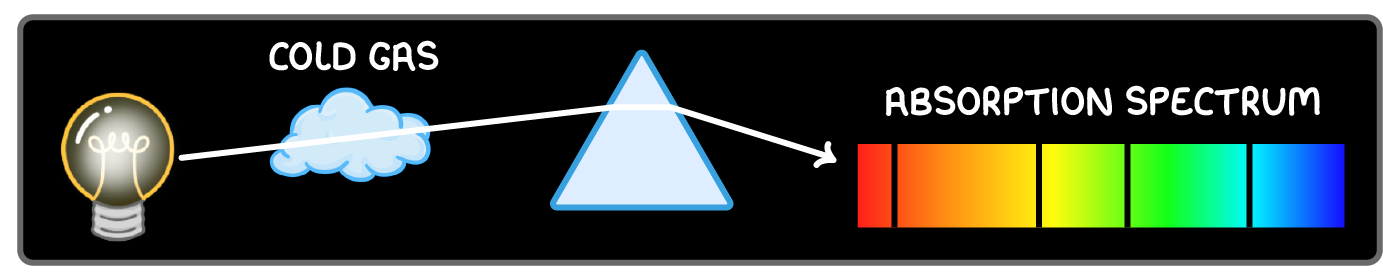
Each absorbed wavelength corresponds to electron transitions in the gas atoms.
Comparing emission and absorption spectra
- Emission spectra show bright lines from emitted wavelengths.
- Absorption spectra show dark lines from absorbed wavelengths.
Both confirm quantised energy levels in gas atoms, since emitted or absorbed photons have energies equal to energy level differences.