Deformation Of Solids
This lesson covers:
- Stress-strain graphs for ductile materials and their key features.
- Stress-strain graphs for brittle materials and how to interpret them.
- How to compare the strength and stiffness of different materials.
- Characteristics of polymeric stress-strain graphs.
Stress-strain graphs for ductile materials
Ductile materials, such as copper, are capable of being shaped or bent without breaking. The stress-strain graph for these materials typically shows a curve, reflecting their ability to stretch and deform. A notable characteristic is that these graphs do not show a sudden breaking point.
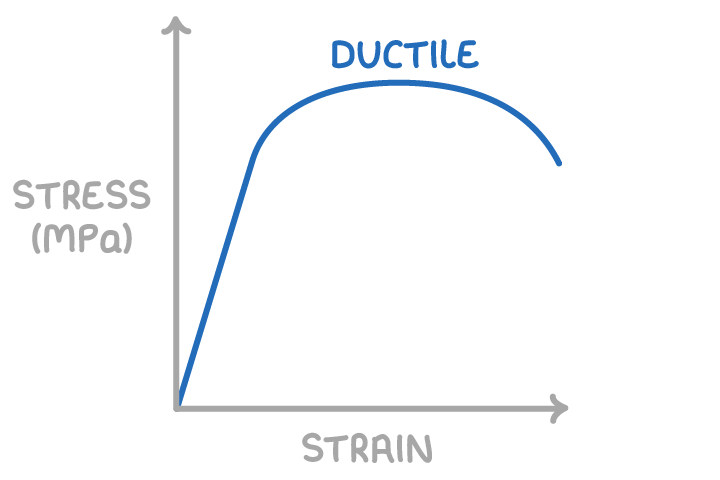
Key features:
- An initial straight line portion indicating the material's obedience to Hooke's Law.
- Beyond the proportional region, the material experiences a large strain for small increases in stress.
- Beyond the yield point, the material experiences noticeable deformation.
Worked example - Comparing strength and stiffness of two materials
Compare the strength and stiffness of the two materials labelled A and B.
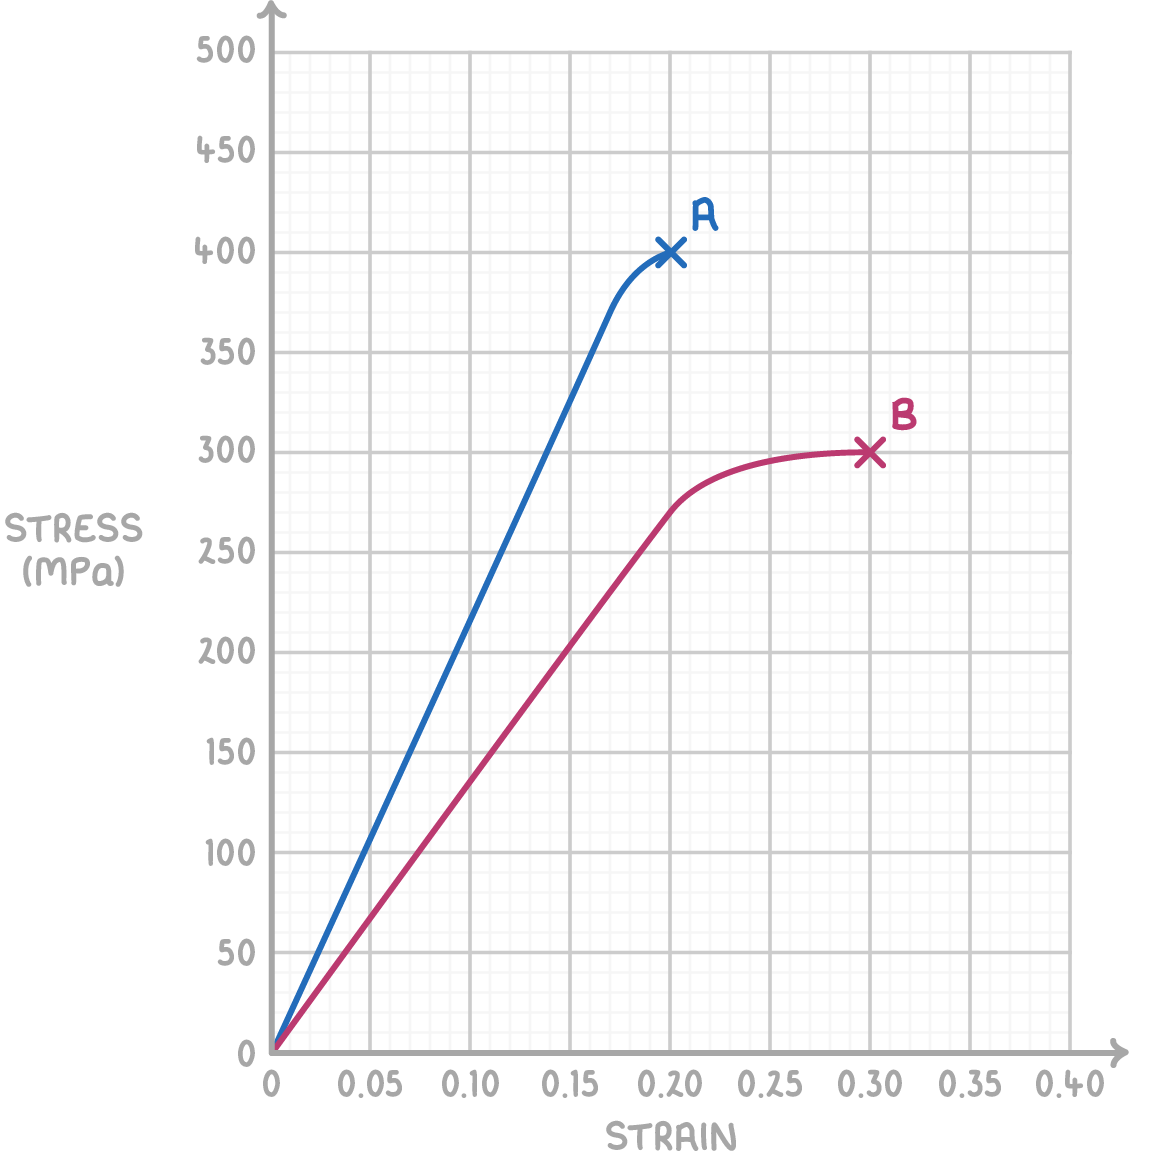
Step 1: Assessing Strength
Strength is indicated by the stress level at which a material breaks.
- Material A: Breaks at 400 MPa.
- Material B: Breaks at 300 MPa.
Material A has a higher breaking stress (400 MPa) compared to Material B (300 MPa), indicating that Material A is stronger.
Step 2: Determining Stiffness
Stiffness relates to how much strain a material experiences under a given stress. A more stiff material will show less strain.
- Material A: Strain at breaking point is 0.02.
- Material B: Strain at breaking point is 0.03.
Since Material A undergoes a lower strain (0.02) compared to Material B (0.03) for the same stress, it is stiffer.
Conclusion:
Material A is both stronger and stiffer than Material B.
Brittle material stress-strain graphs
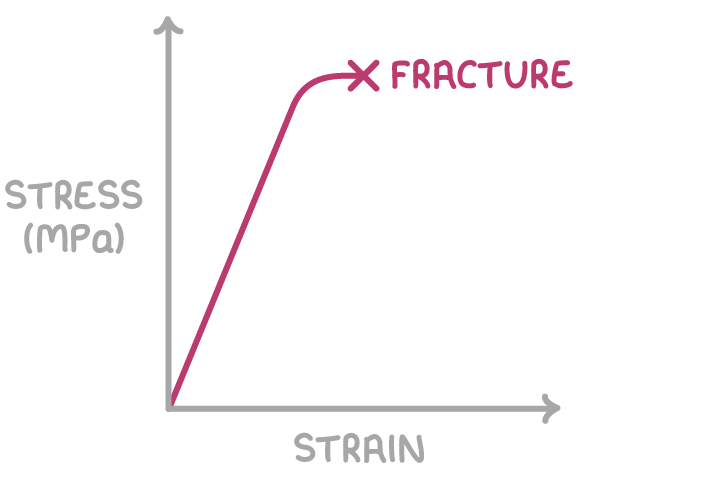
Brittle materials, like glass, tend to break without significant plastic deformation. Their stress-strain graphs typically:
- Initially obey Hooke's law.
- Abruptly end at the breaking stress, indicating a sudden failure.
Comparing material strength and stiffness
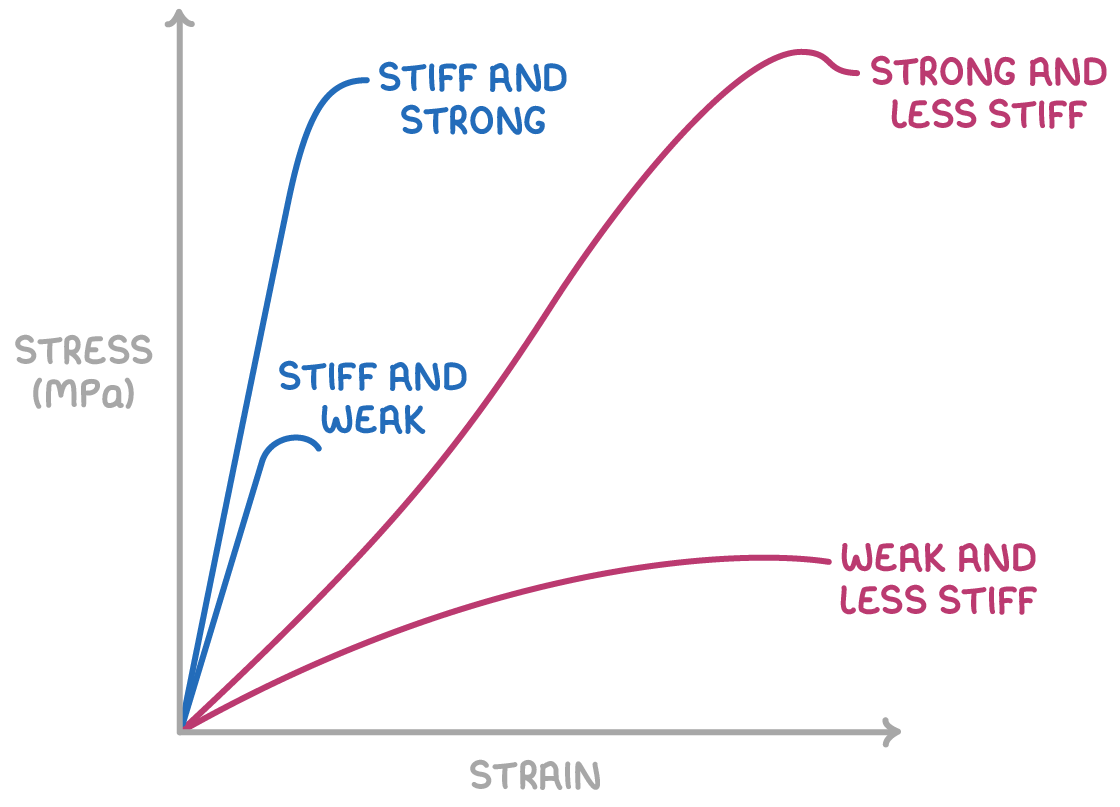
Key points:
- Stronger materials can withstand higher stresses before breaking.
- Stiffer materials exhibit less strain for a given stress.
- Strength and stiffness are distinct and independent properties of a material.
Polymeric stress-strain graphs
Polymers, like rubber and polythene, consist of long chain molecules, giving them unique stress-strain graph characteristics:
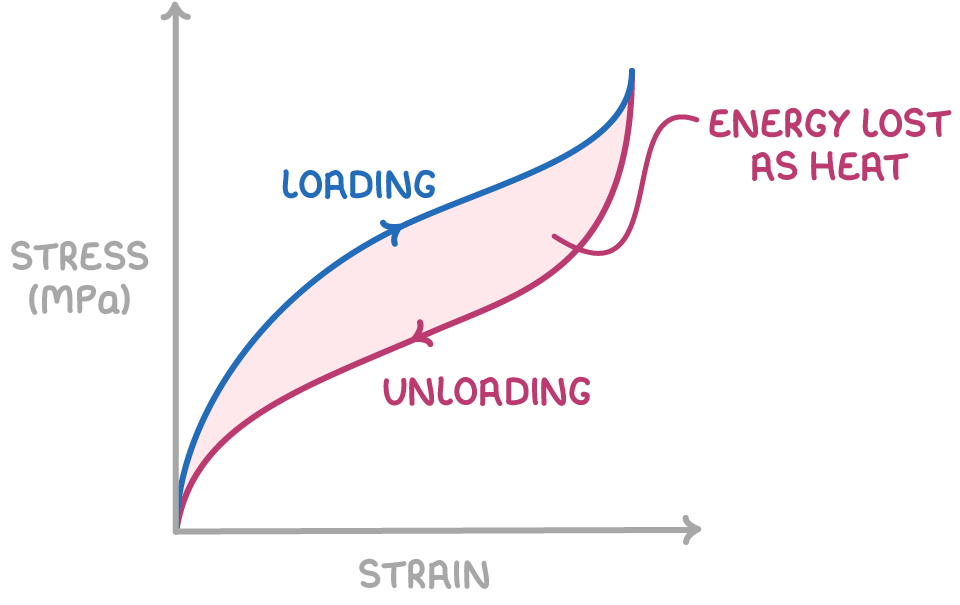
Key points:
- Rubber typically displays elastic behaviour.
- Polythene experiences plastic deformation.
- Energy loss in polymers is evident in the area between the loading and unloading curves.