Distance-time graphs
This lesson covers:
- What distance-time graphs show
- Interpreting distance-time graphs
What are distance-time graphs?
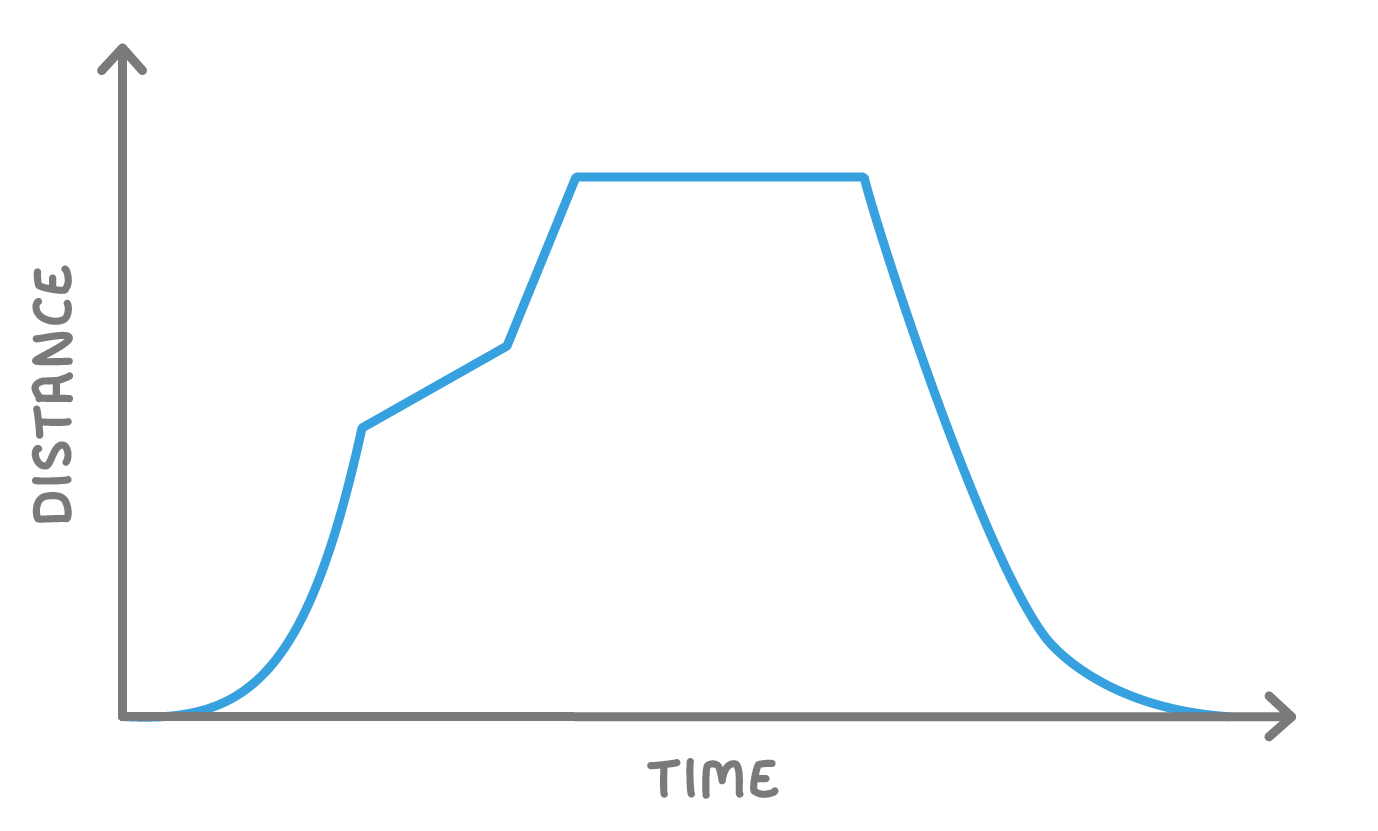
A distance-time graph shows how the distance travelled by an object changes over time.
The line on the graph shows the relationship between distance and time for a moving object.
We can use distance-time graphs to find out information about objects in motion.
Interpreting distance-time graphs
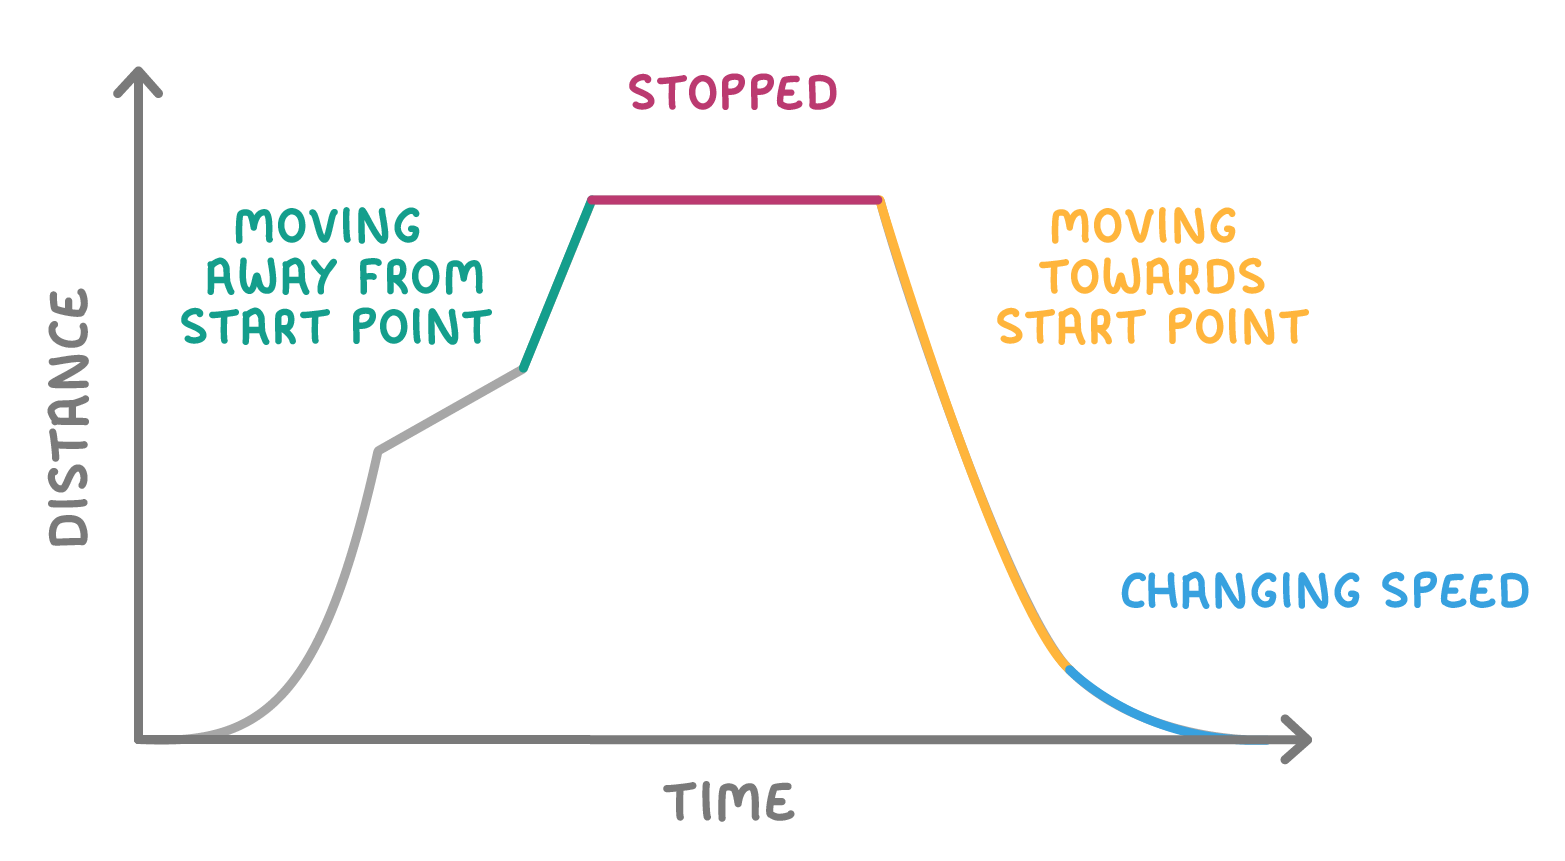
There are several key features of distance-time graphs that tell us about an object's motion:
- Slope - The steepness of the graph line relates to speed.
- Flat sections - Where the line is flat (zero gradient), the object is stopped.
- Downhill sections - When the line slopes down, the object moves back toward the starting point.
- Curves - Curved sections mean changing speed.
Relating graph features to motion
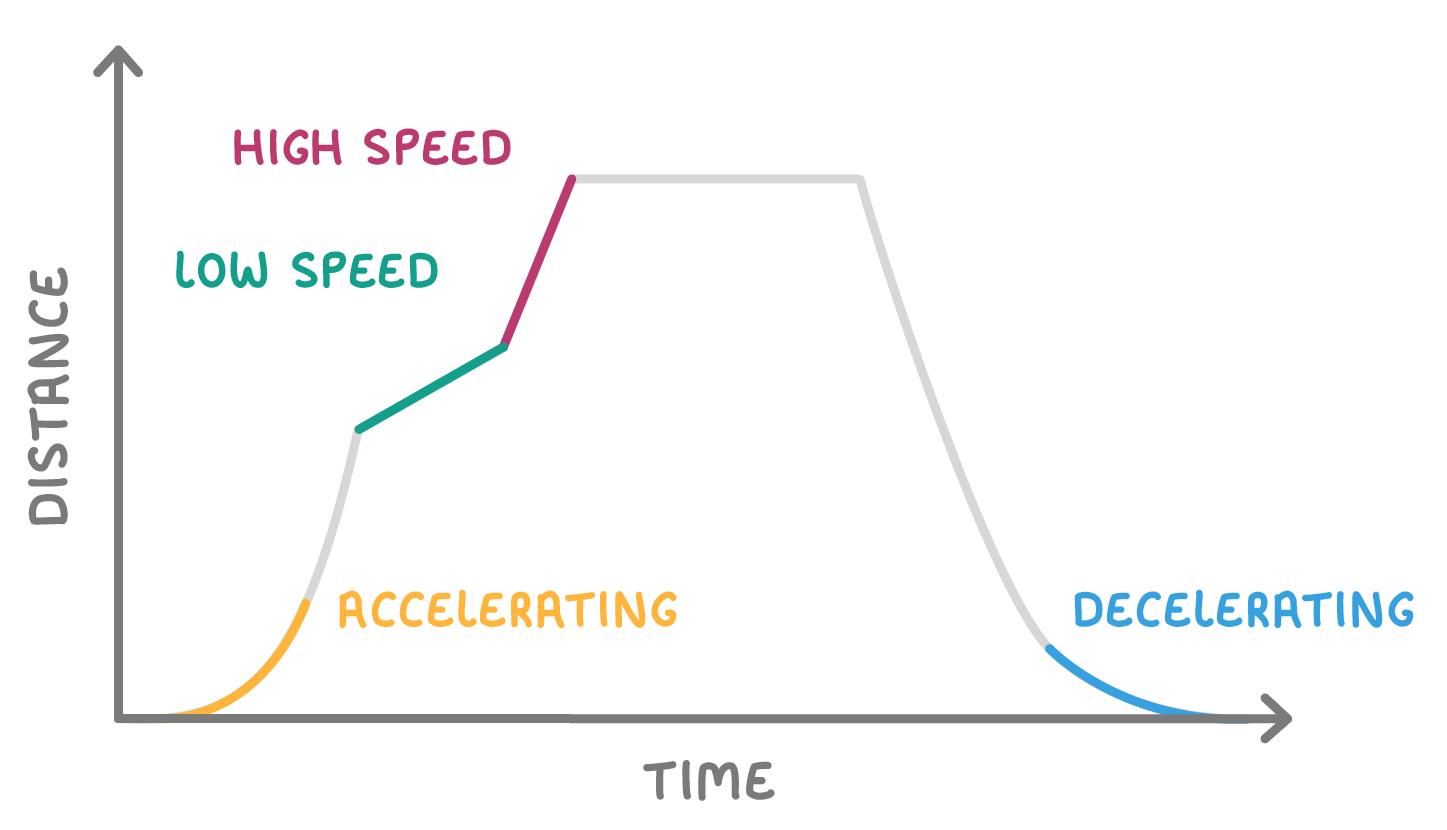
We can link graph features to details about an object's motion:
- Steeper slopes mean faster speed.
- Gentler slopes mean slower speed.
- Steepening curves indicate accelerating.
- Levelling-off curves indicate decelerating.