Force diagrams
This lesson covers:
- What force diagrams show
- Adding and subtracting forces on force diagrams
What are force diagrams?
Force diagrams are visual representations that show the forces acting on an object.

The diagrams indicate:
- The direction and magnitude of forces using arrows.
- Whether the forces are balanced or unbalanced.
- If an object is accelerating, decelerating, or moving at a steady speed.
Showing forces on force diagrams

To draw a force diagram:
1. Identify all the forces acting on the object.
2. Draw arrows to represent each force.
- Arrow direction shows force direction.
- Arrow length shows force magnitude.
- Longer arrows for larger forces, shorter for smaller.
3. Label each force with its value in newtons (N).
Adding and subtracting forces
When forces act along the same line, you can add or subtract them to determine the overall force.
Calculating the overall force - example 1
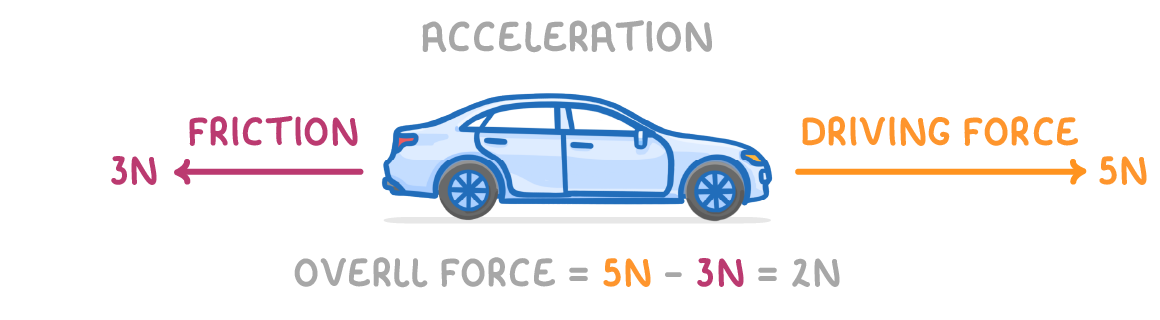
- The forward force is larger than the backwards force so the forces are unbalanced.
- The overall force is positive so the object is accelerating.
Calculating the overall force - example 2
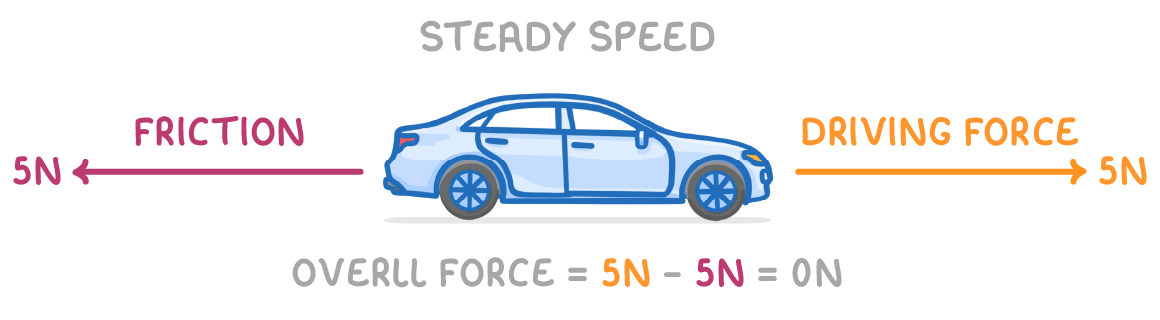
- The forward force is the same size as the backward force so the forces are balanced.
- The overall force is 0 so the object is moving at a steady speed.
Calculating the overall force - example 3
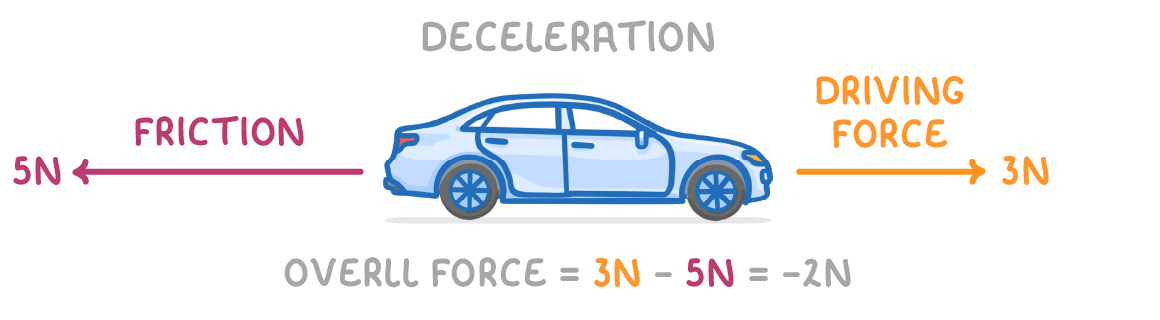
- The backwards force is larger than the forwards for so the forces are unbalanced.
- The overall force is negative so the object is decelerating.