Tree Diagrams
This lesson covers:
- What tree diagrams are
- How to use tree diagrams
Probability tree diagrams Probability tree diagrams show the probabilities of a set of events. To create them you put the events at the end of each branch, and the probabilities of those events on the branches. |
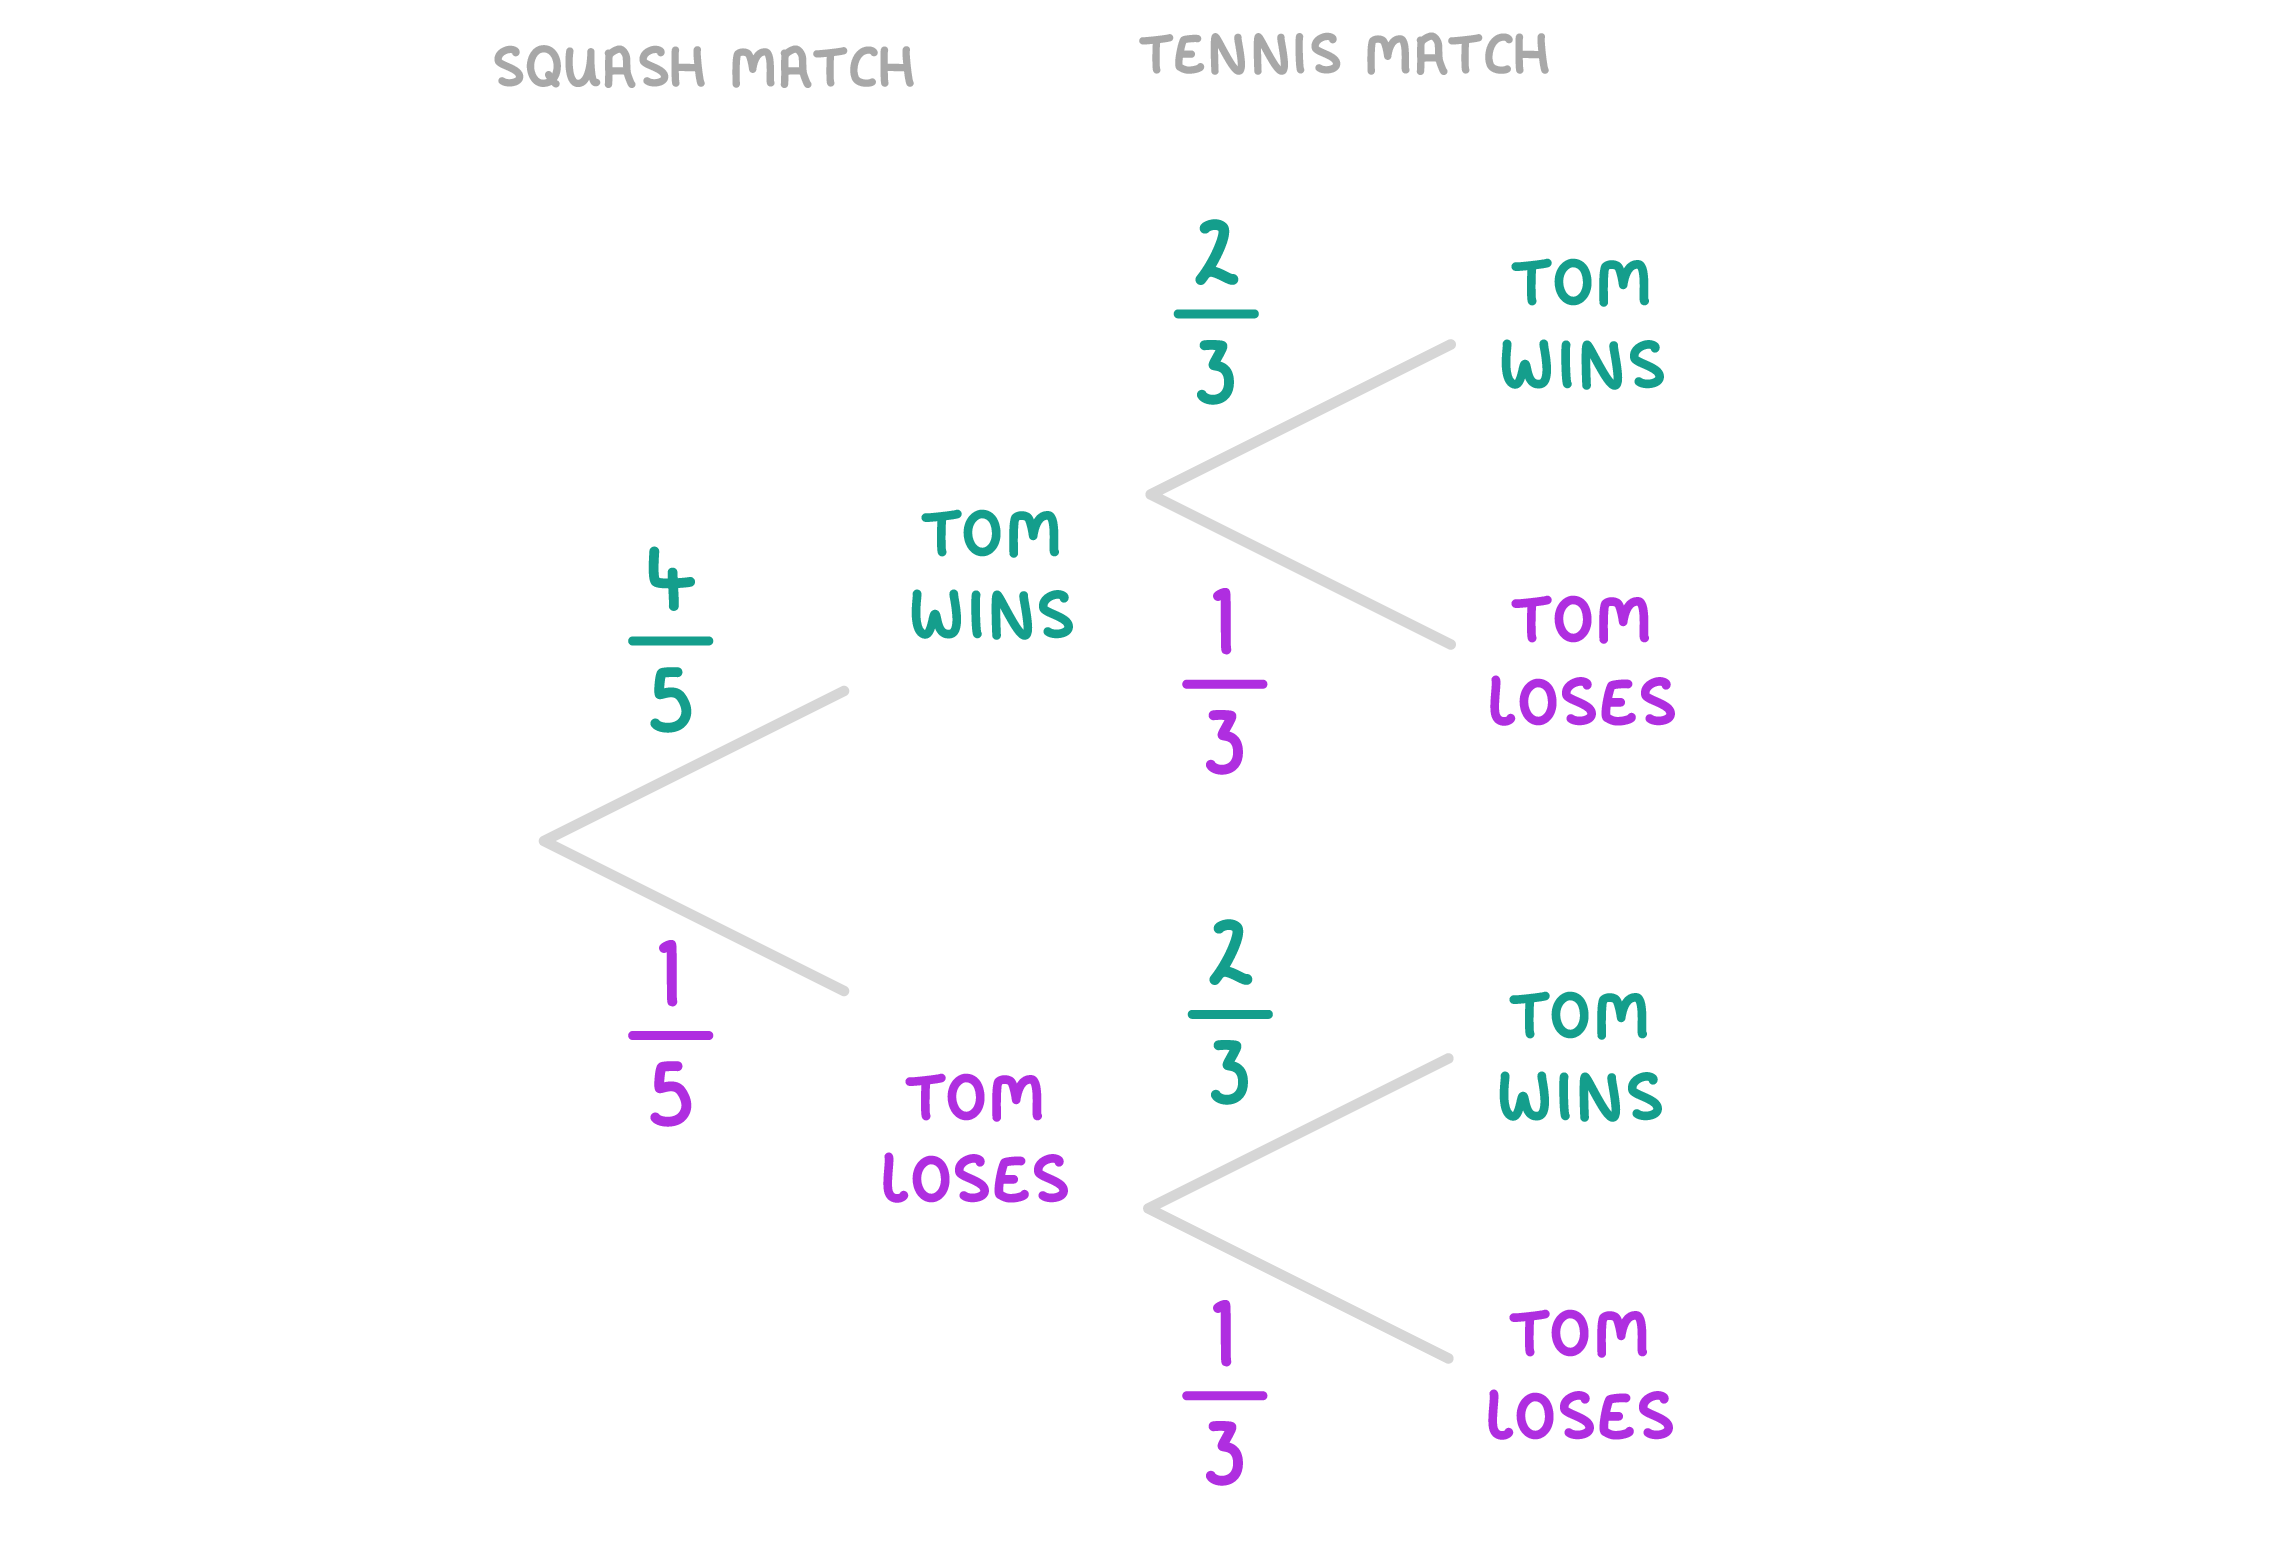
Example: Tom is going to play one squash match and one badminton match. The probability that he will win the squash match is 4/5. The probability that he will win the tennis match is 2/3. What is the probability that he will only win one of the games? |
Step 1: Construct a probability tree diagram.  |
Part 2: Use the AND rule. From the tree diagram, we can see that there are two paths in which tom only wins one game:
We can find the probability of each of these paths using the AND rule.
|
Part 3: Use the OR rule. The final step is to add the two probabilities we've found together, to find the probability of either of them happening. P(winning only one game) = 4/15 + 2/15 = 6/15 P(winning only one game) = 2/5 (this is 6/15 simplified) |
Using the tree diagram below, what is the probability that Tom wins both the squash match and the badminton match?
Give you answer as a fraction in its simplest form.

|
Using the tree diagram below, what is the probability that Tom loses both the squash match and the badminton match?
Give you answer as a fraction in its simplest form.
|
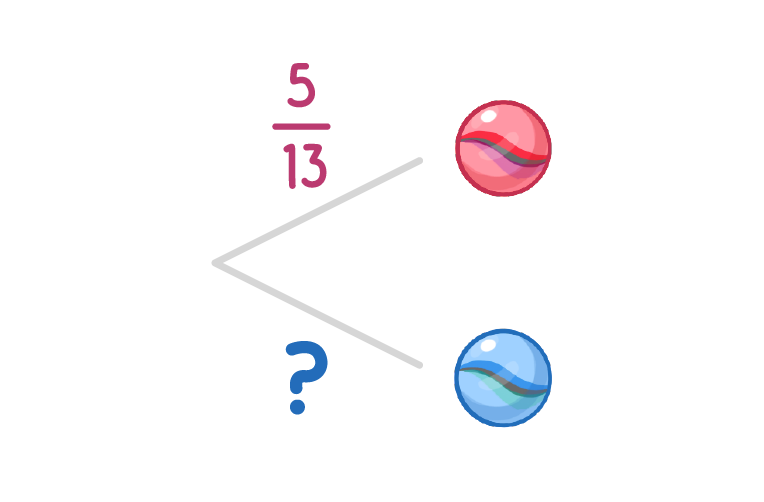
The diagram below shows the first branch of a probability tree.
What should the missing probability be?
|
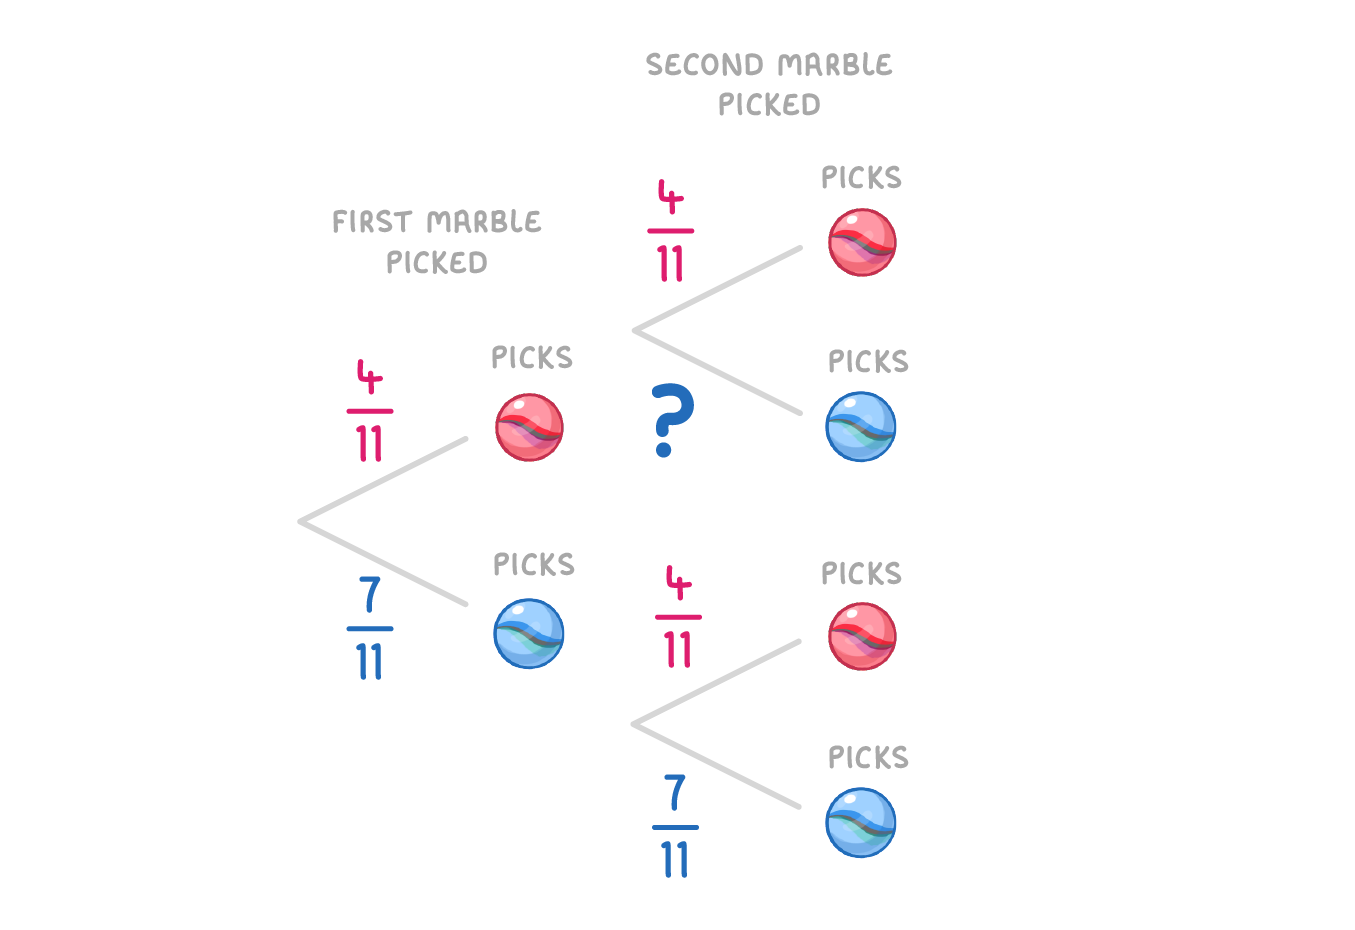
The image below shows a probability tree for picking 2 marbles from a jar. The first marble is replaced before picking the second.
What is the missing probability?
|
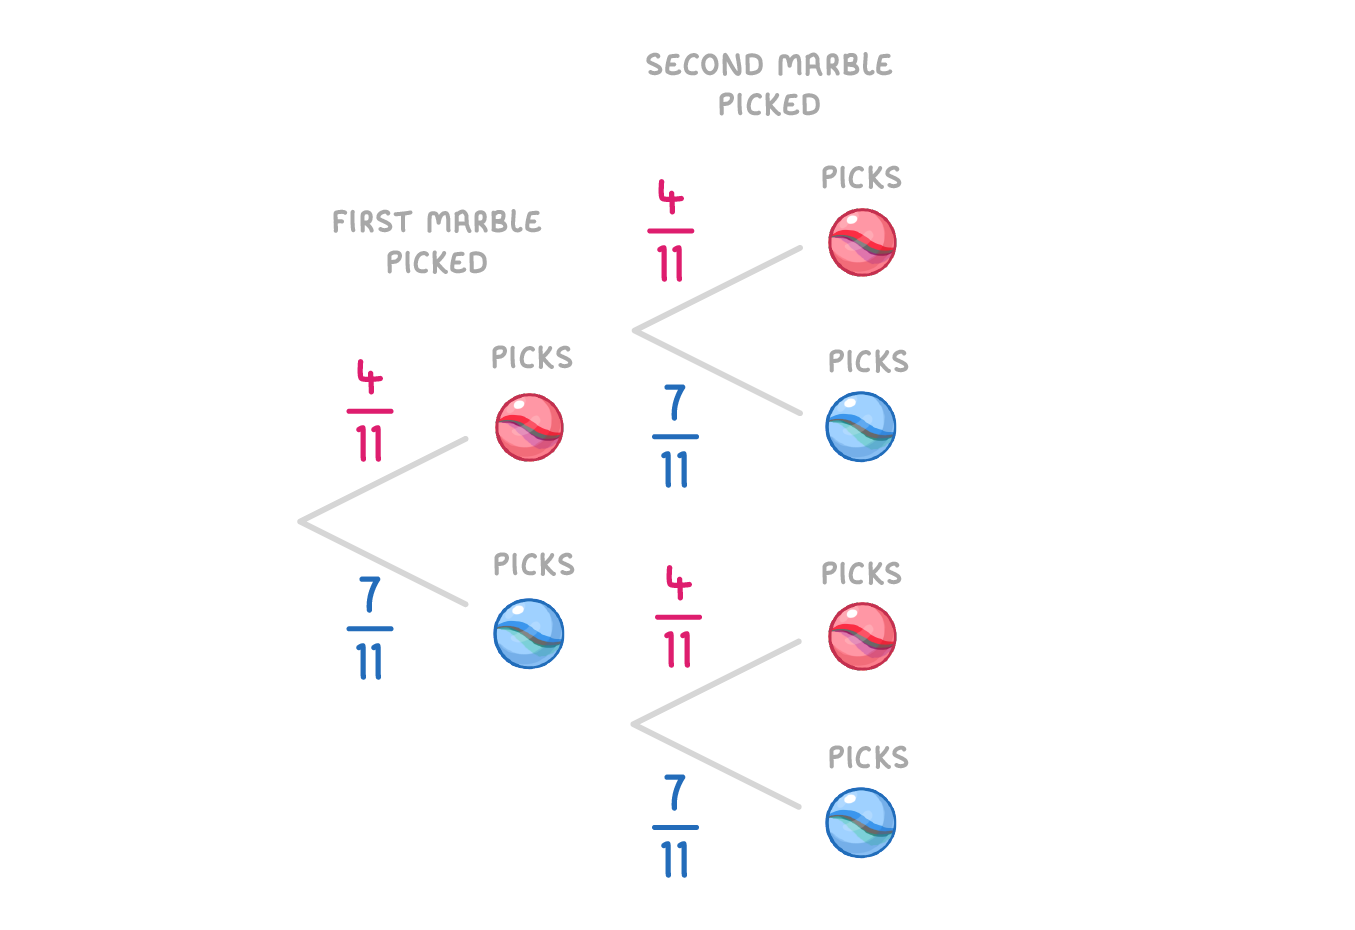
The image below shows a probability tree for picking 2 marbles from a jar. The first marble is replaced before picking the second.
What is the probability of both marbles being blue? Give your answer as a fraction in its simplest form.
|