Velocity-Time Graphs
This lesson covers:
- How to interpret a velocity-time graph
- What the different parts of a velocity-time graph tell us about the motion of the object
- How to calculate the distance travelled from a velocity-time graph
On a velocity / time graph, the velocity is on the -axis, and the time is on the -axis.
|
A flat line on the velocity / time graph tells us the object is moving at constant .
|
The gradient of a velocity / time graph tells us:
The amount of time elapsed
The acceleration or deceleration of the object
The velocity of the object
The distance travelled by the object
|

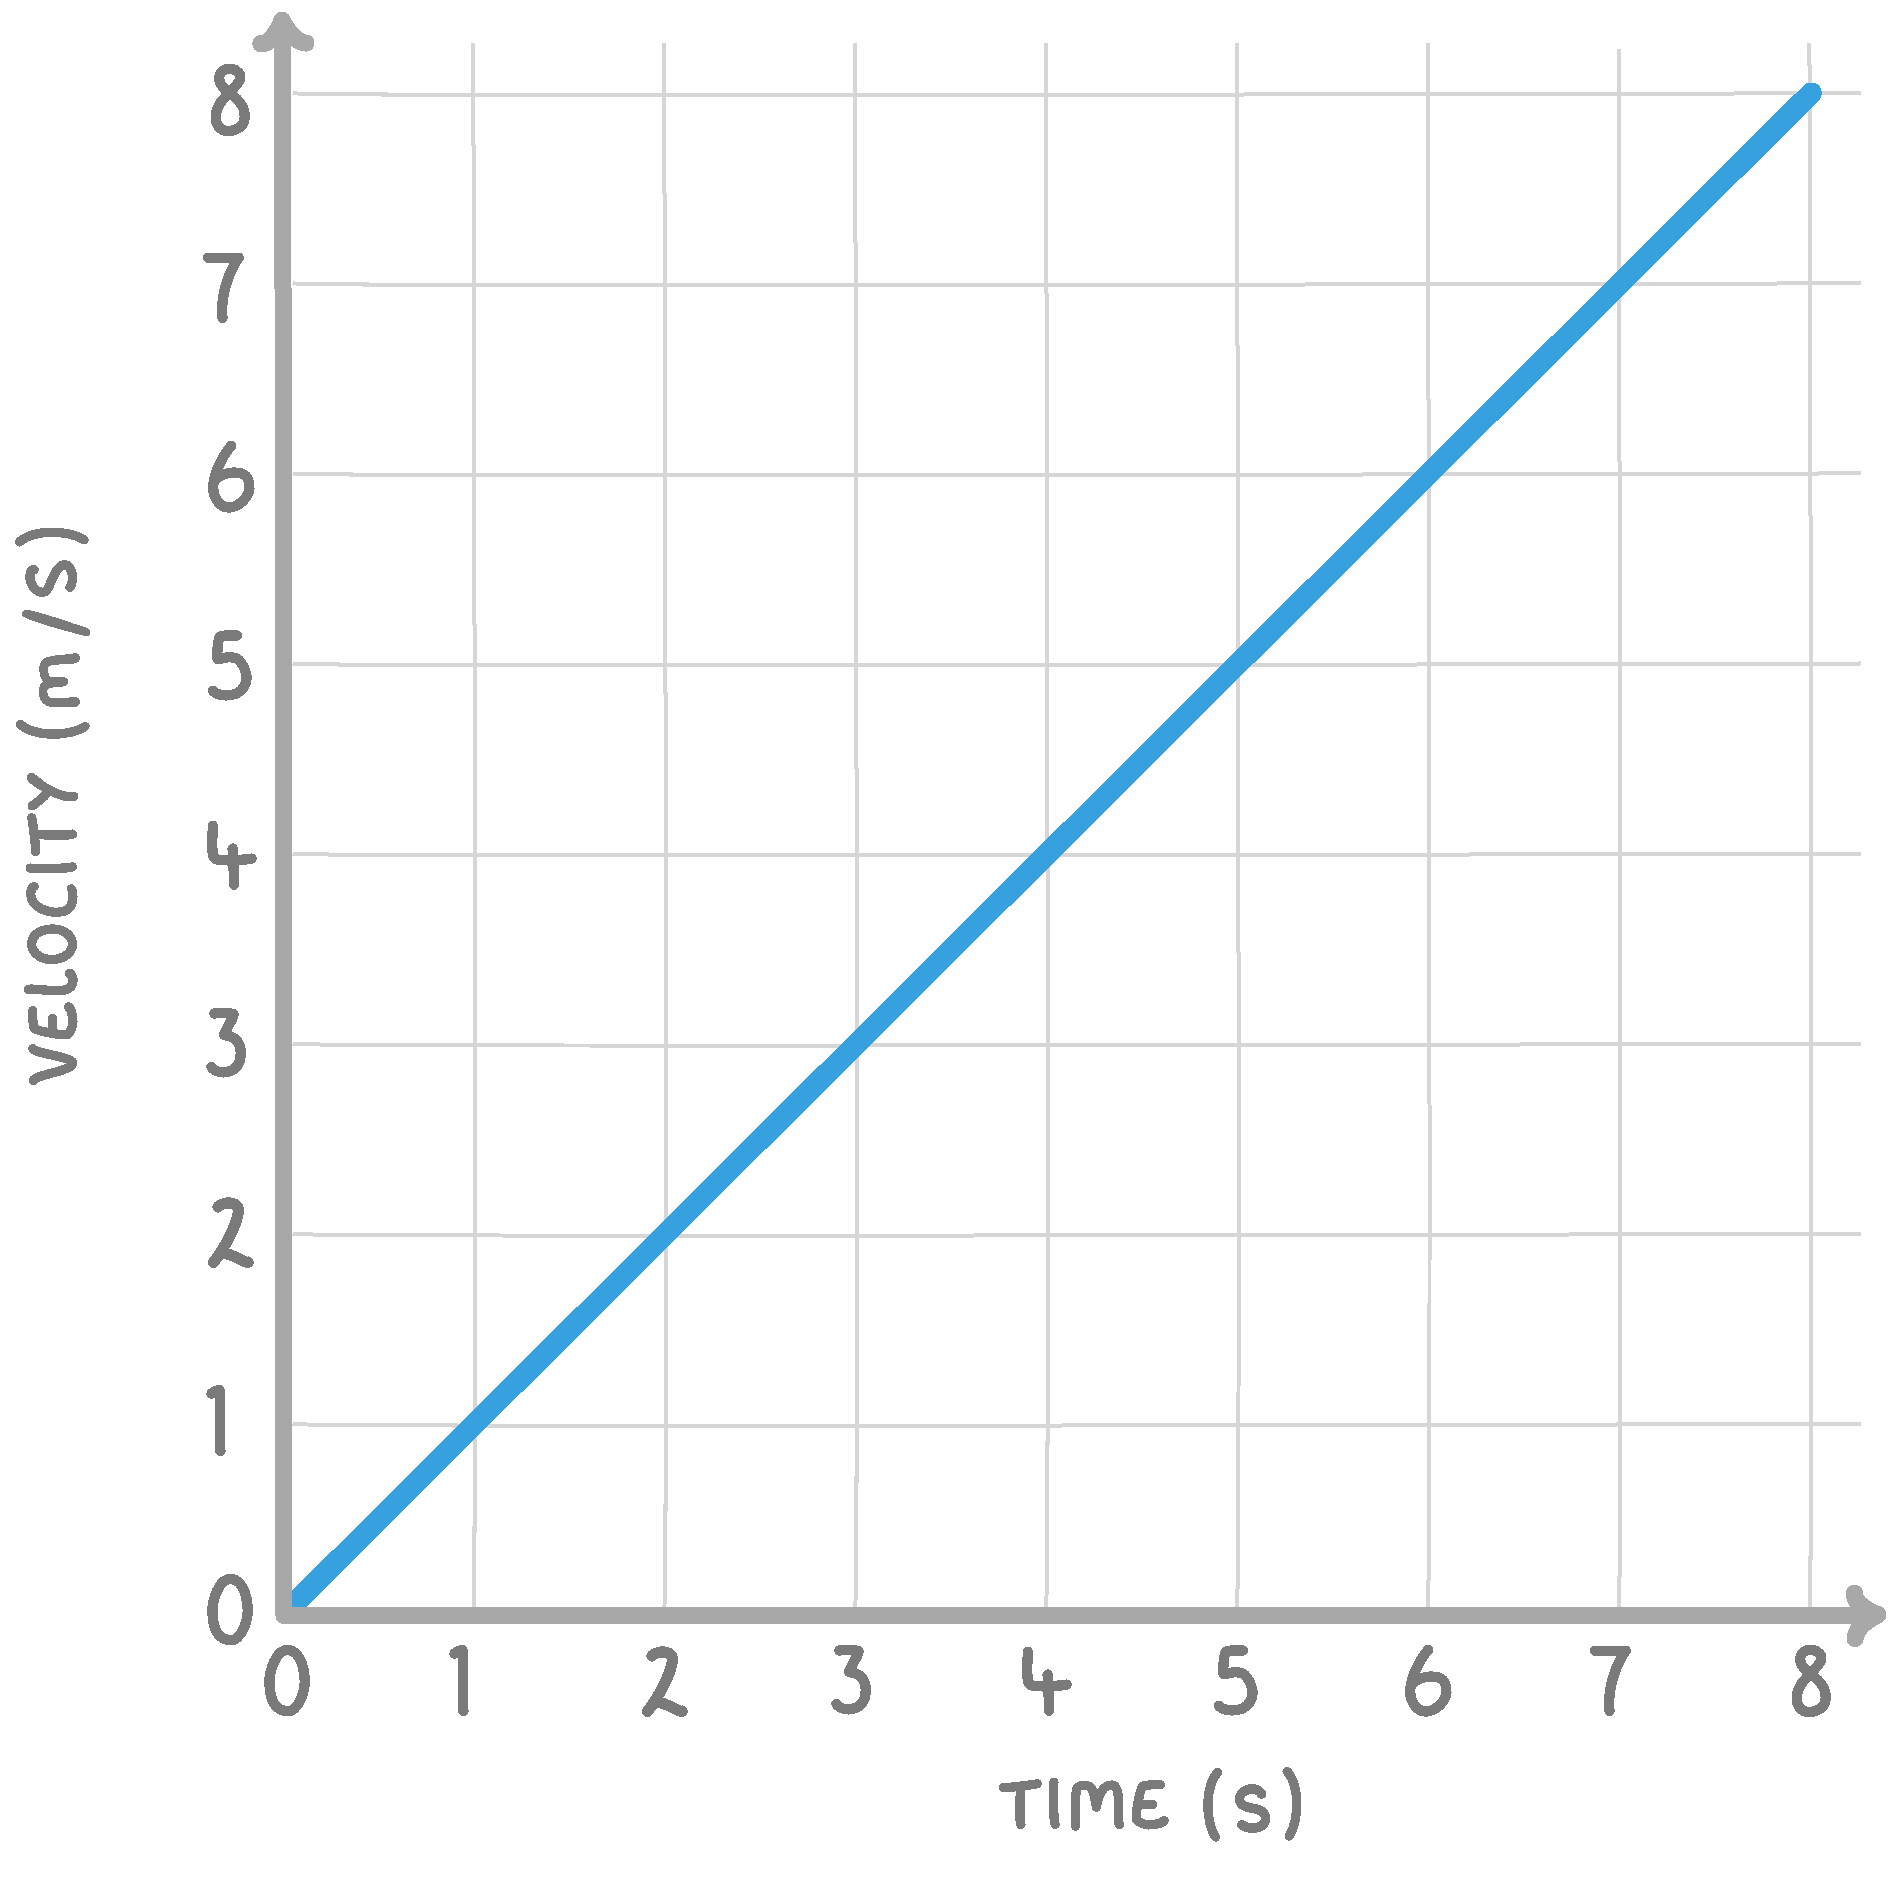
The above velocity / time graph shows an object which is:
Decelerating
Stationary
Accelerating
Travelling at a constant velocity
|
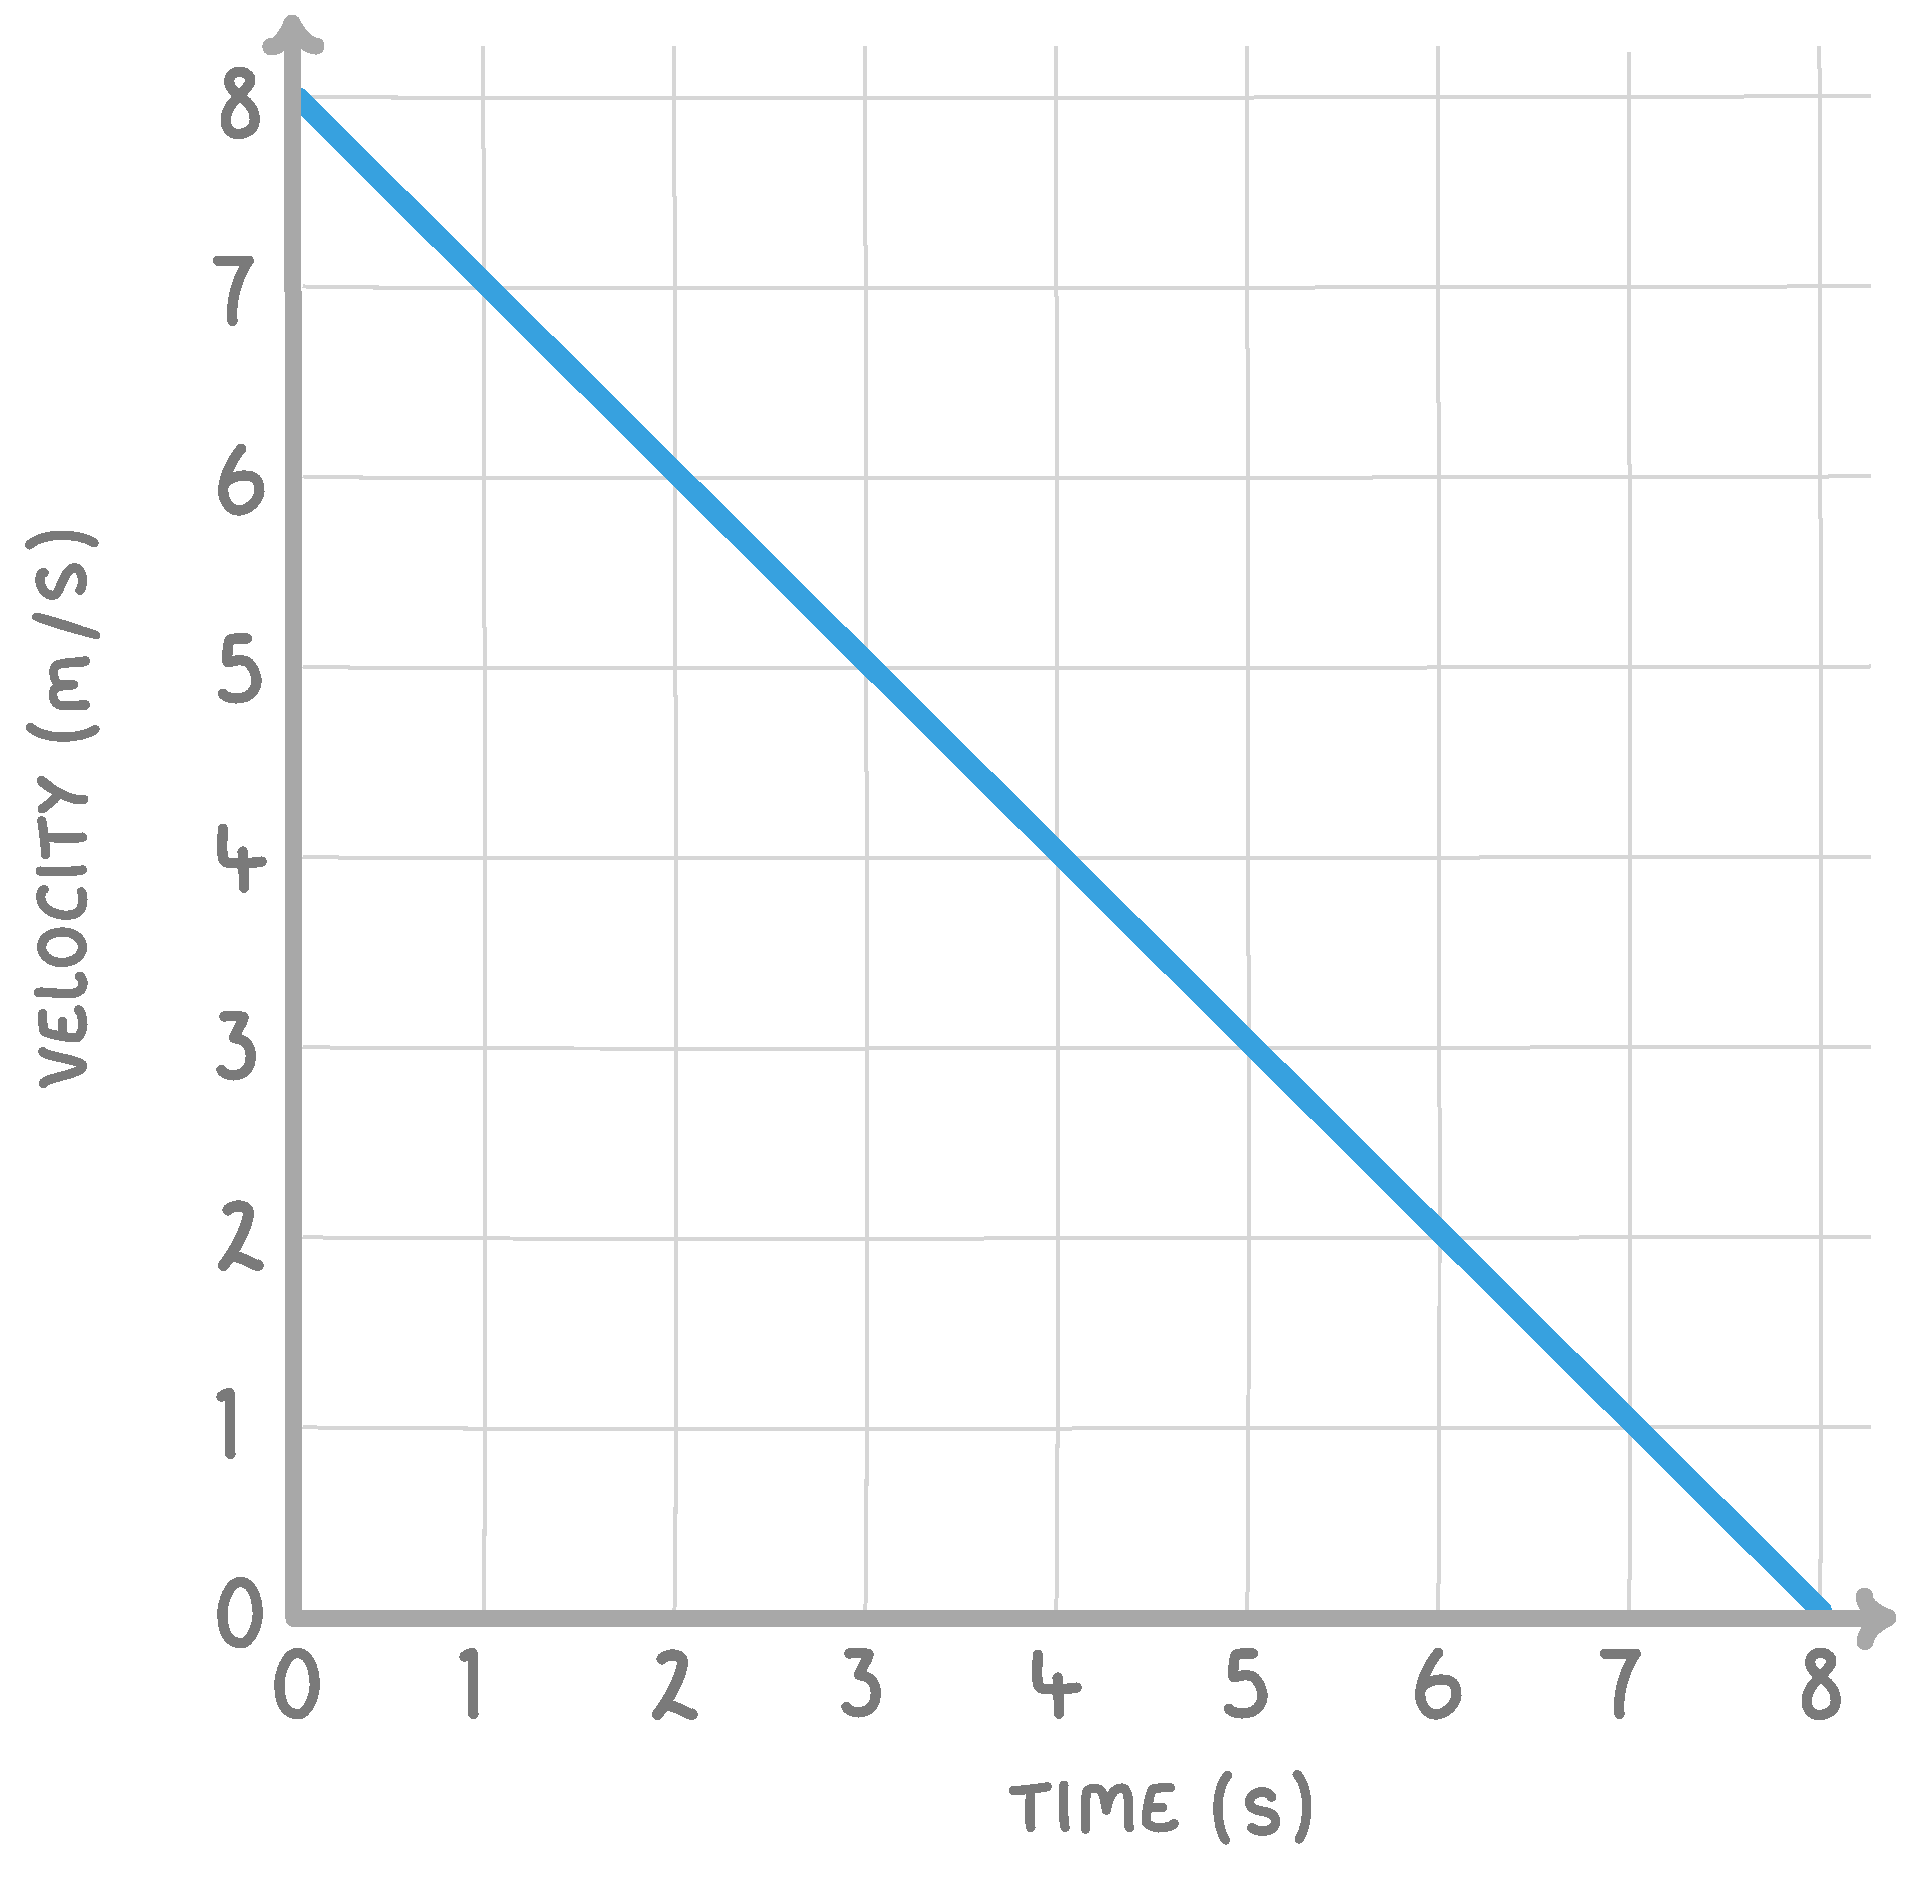
The above velocity / time graph shows an object which is:
Stationary
Accelerating
Decelerating
Travelling at a constant velocity
|
The above velocity / time graph shows an object which is:
Travelling at a constant velocity
Stationary
Decelerating
Accelerating
|
On a velocity / time graph, the distance travelled is shown by:
The gradient of the curve
The area above the curve
The area under the curve
The height of the curve
|
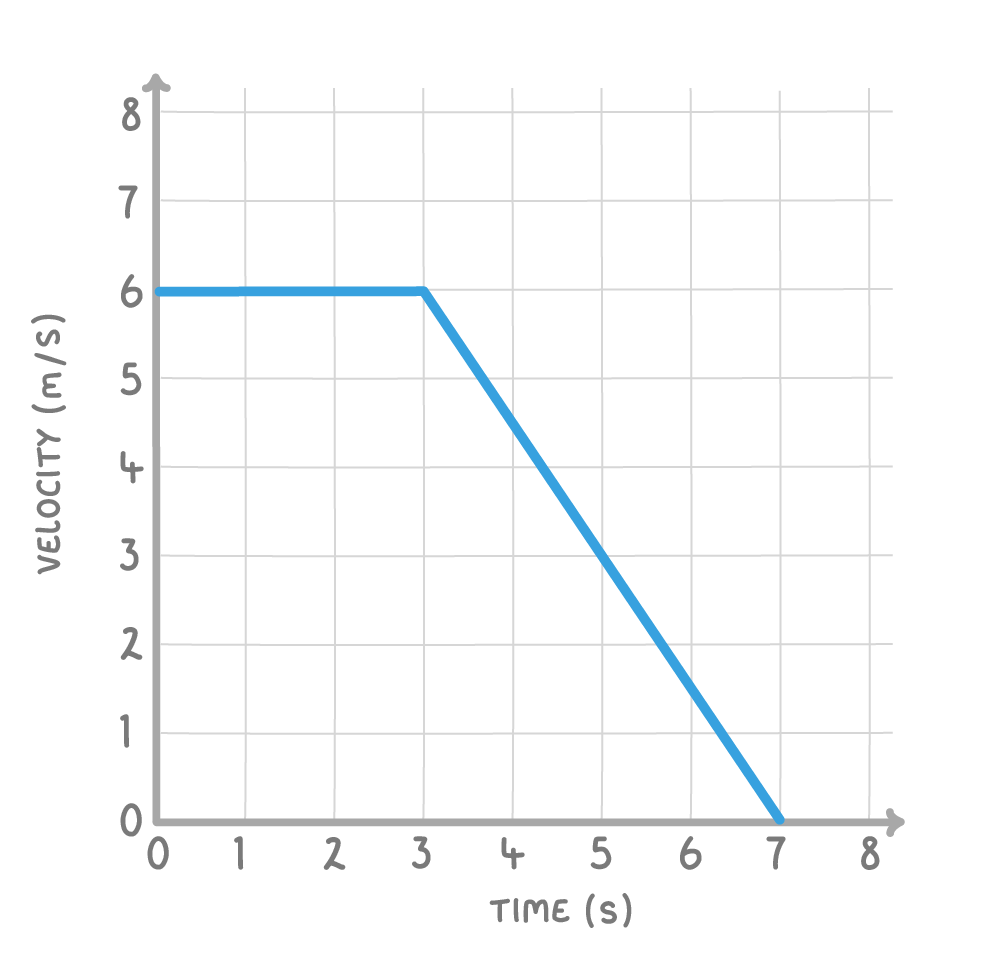
The above velocity / time graph shows a runner travelling at a constant speed, and then slowing to a stop.
Calculate the distance travelled by the runner in the 7 s shown.
m
|