Conversion Graphs
This lesson covers:
- How to use conversion graphs to convert between units
- E.g. Convert miles to km using a graph
Use the conversion graph below to convert £23 to Euros (€).
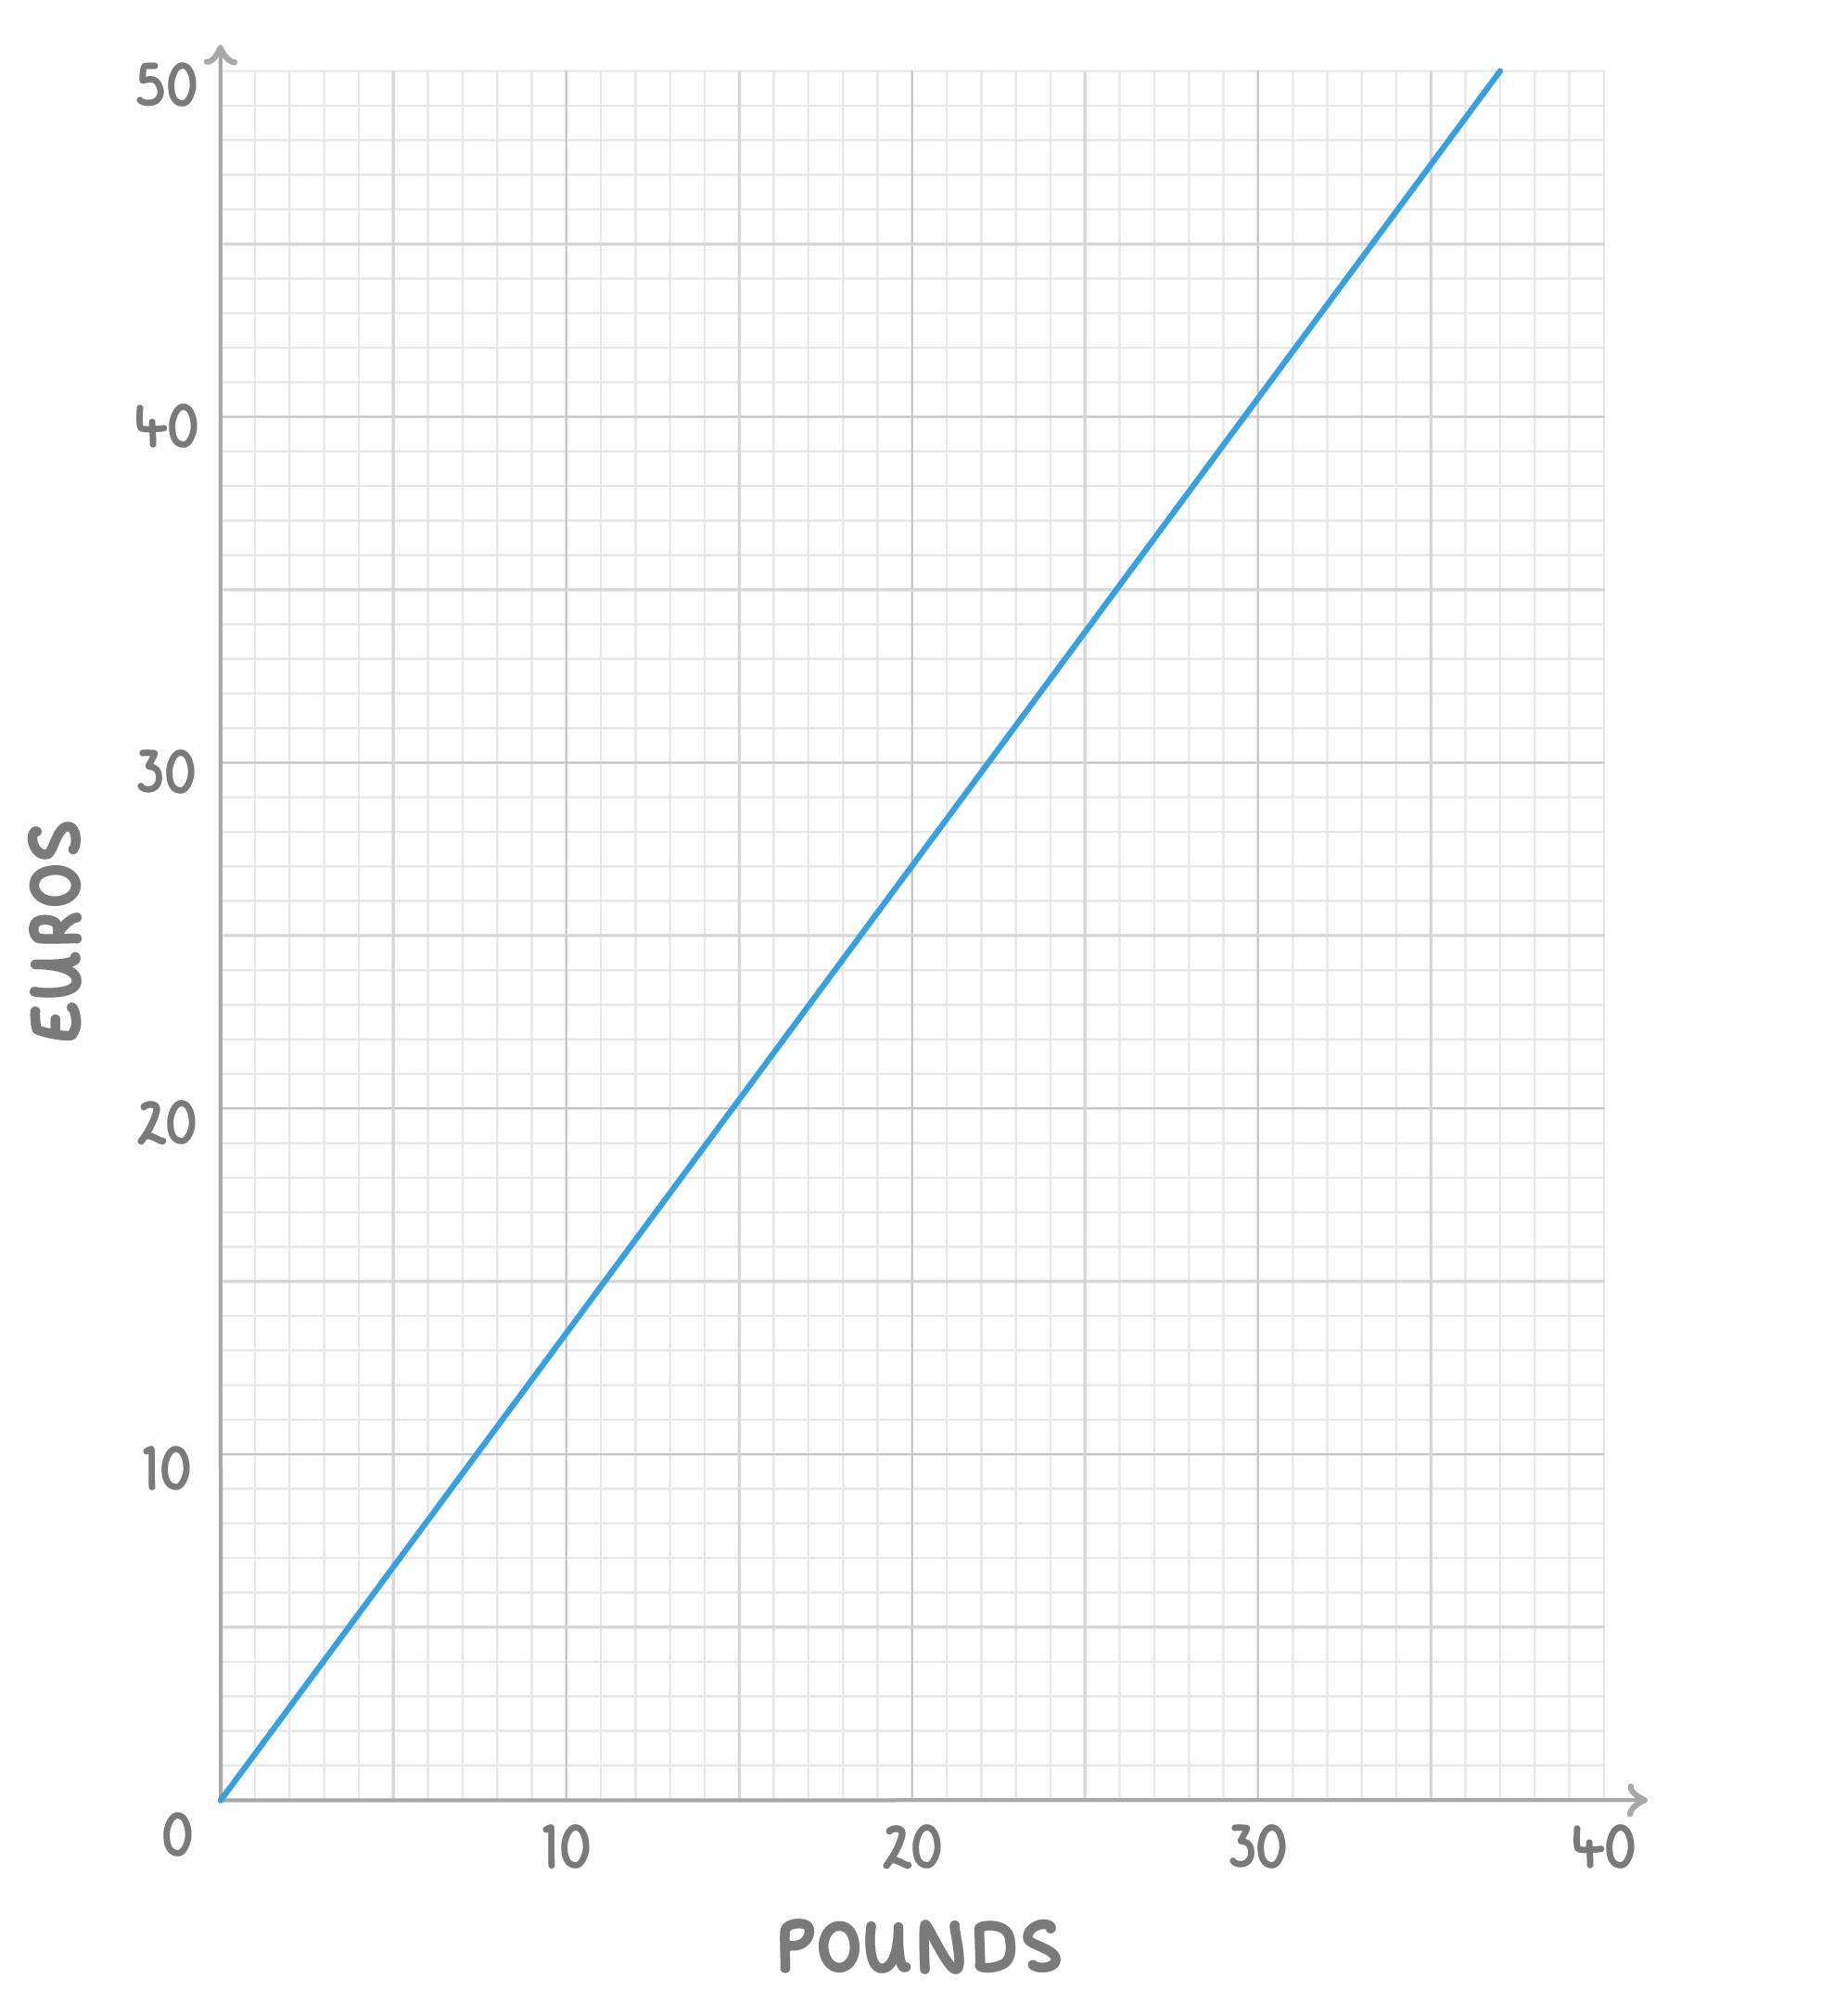
€
|
Use the conversion graph below to convert €15 to Pounds (£).

£
|
Use the conversion graph below to convert €200 to Pounds (£).
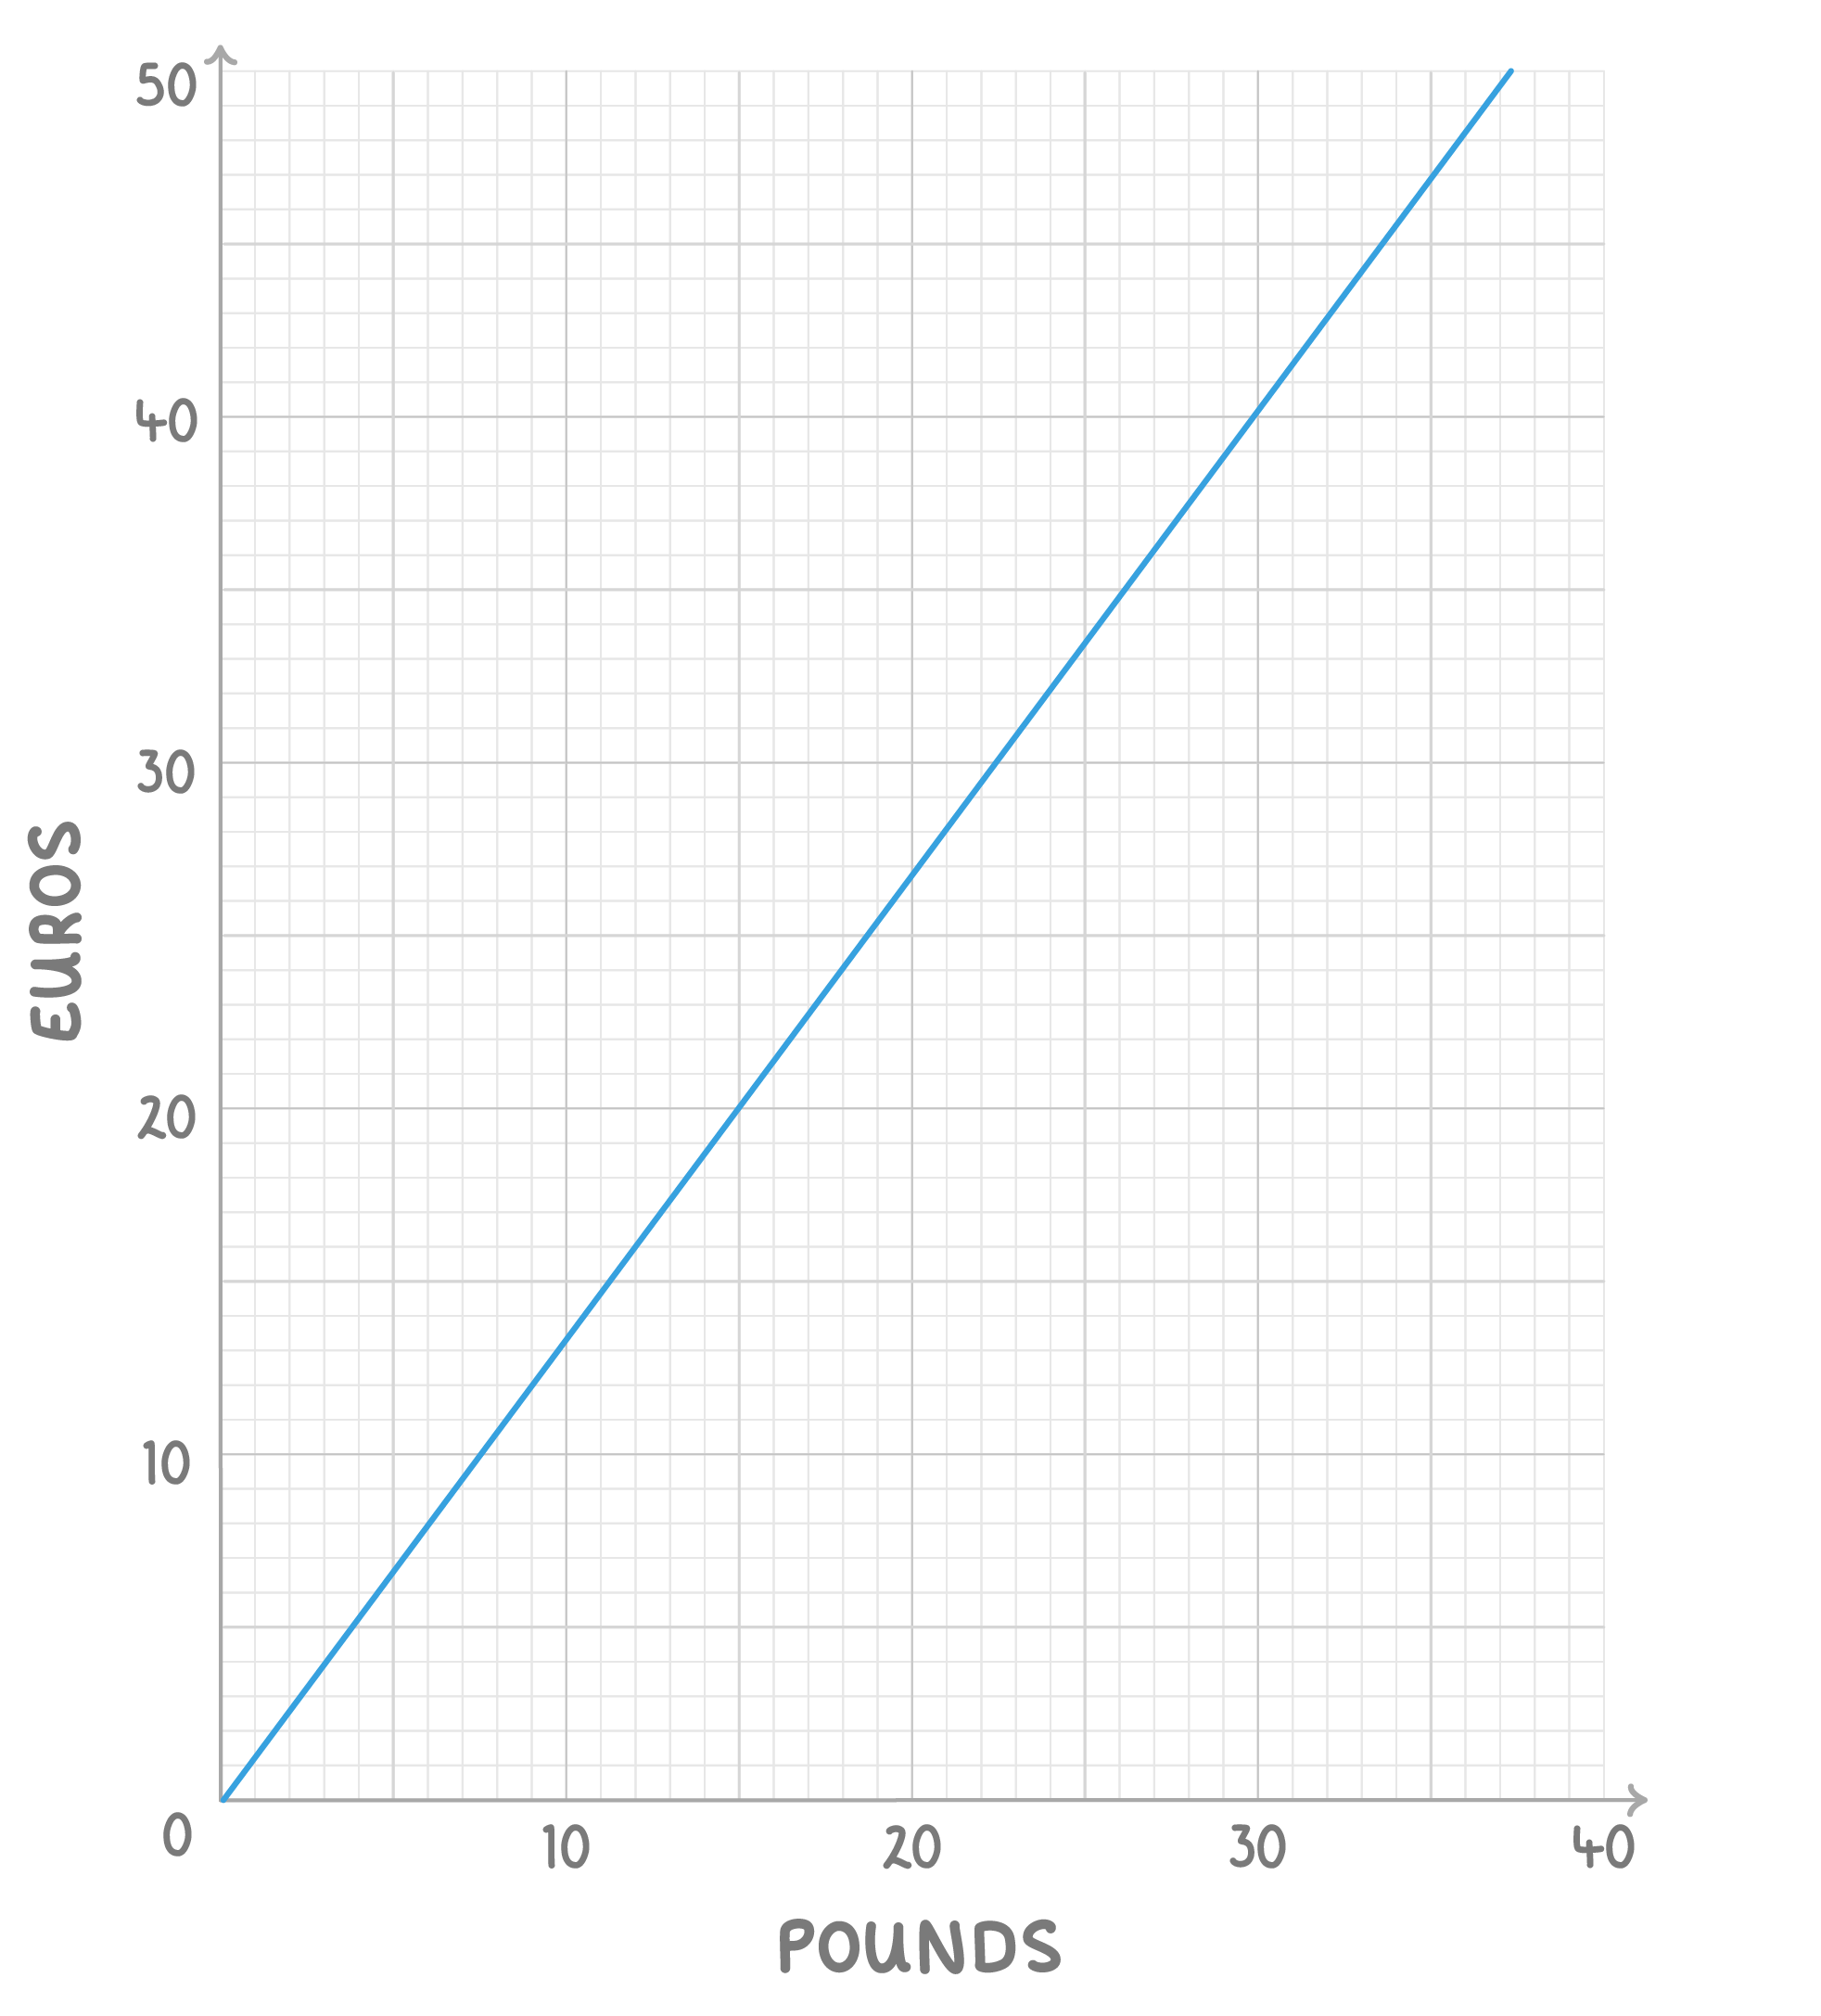
£
|
Use the conversion graph below to convert 21 feet to metres.

metres
|
Use the conversion graph below to convert 7 metres to feet.

feet
|
Use the conversion graph below to convert 300 feet to metres.
(Give your answer to 1 significant figure)
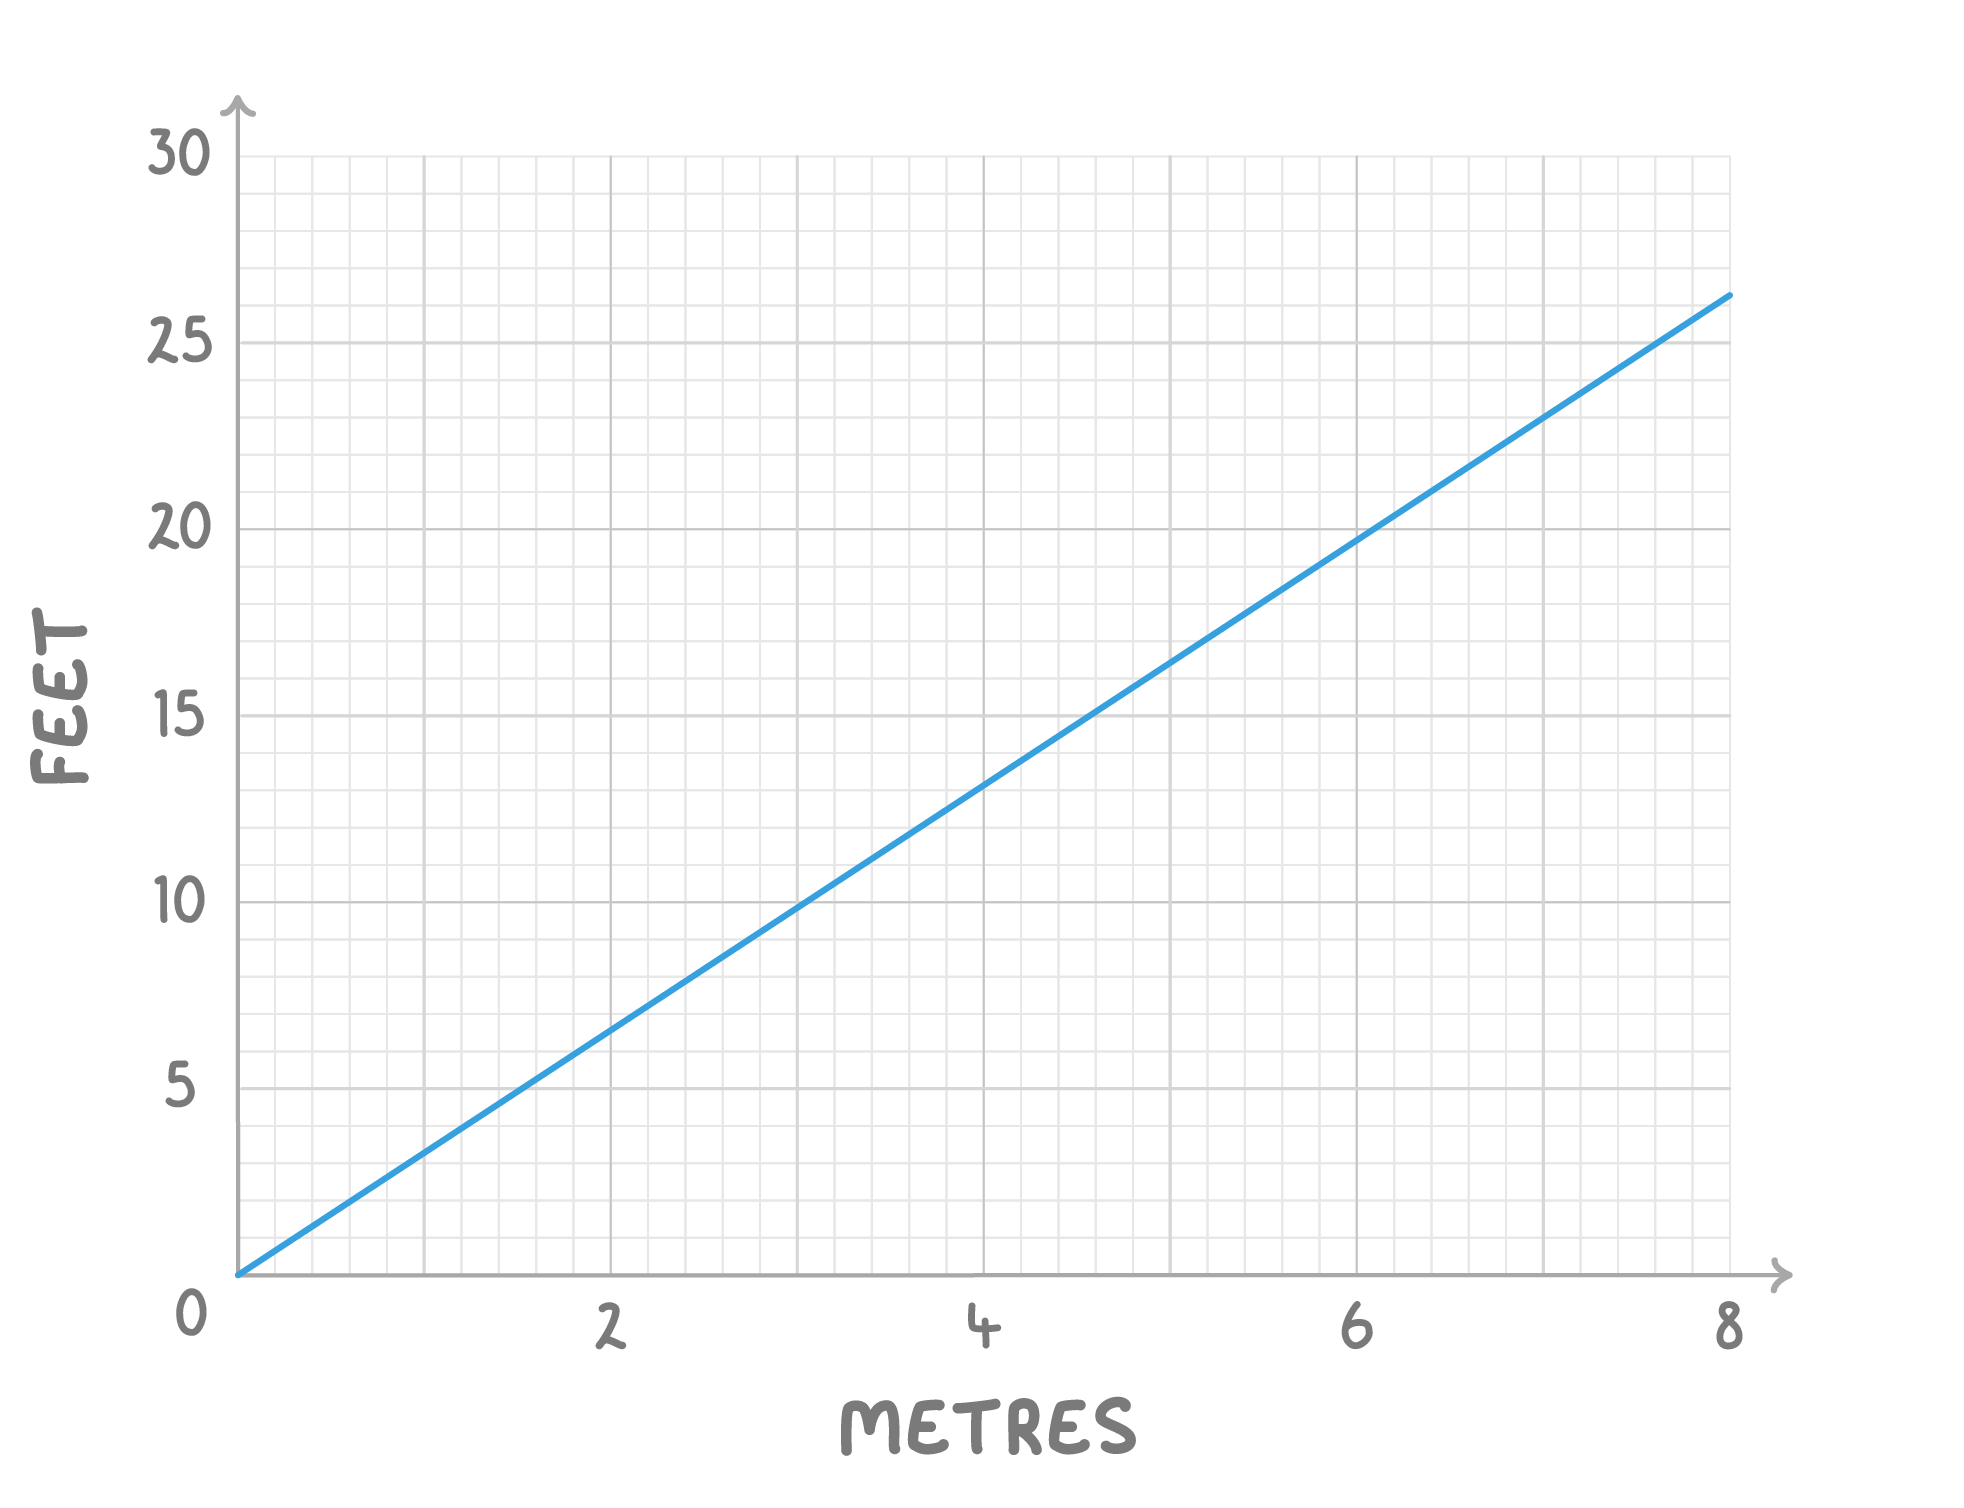
metres
|