Reciprocal Graphs
This lesson covers:
- What a reciprocal graph is
- How to plot a reciprocal graph
Which of the following shows a reciprocal graph?
|
Which of the following equations represents a reciprocal graph?
y=3x+2
y=x3
y=x2+3x−5
|
Which of the following equations represents a reciprocal graph?
y=2x
y=x5
y=(x3)2
|
Below is the graph for:
y=x1
Where are the two lines of symmetry?
|
On the graphs below, the grey curve represents:
y=x1
Which graph also has a line showing y=x0.5?
|
On the graphs below, the grey curve represents:
y=x1
Which of the options below does the green line represent?
y=x0.5
y=x1
y=x4
y=−x1
|
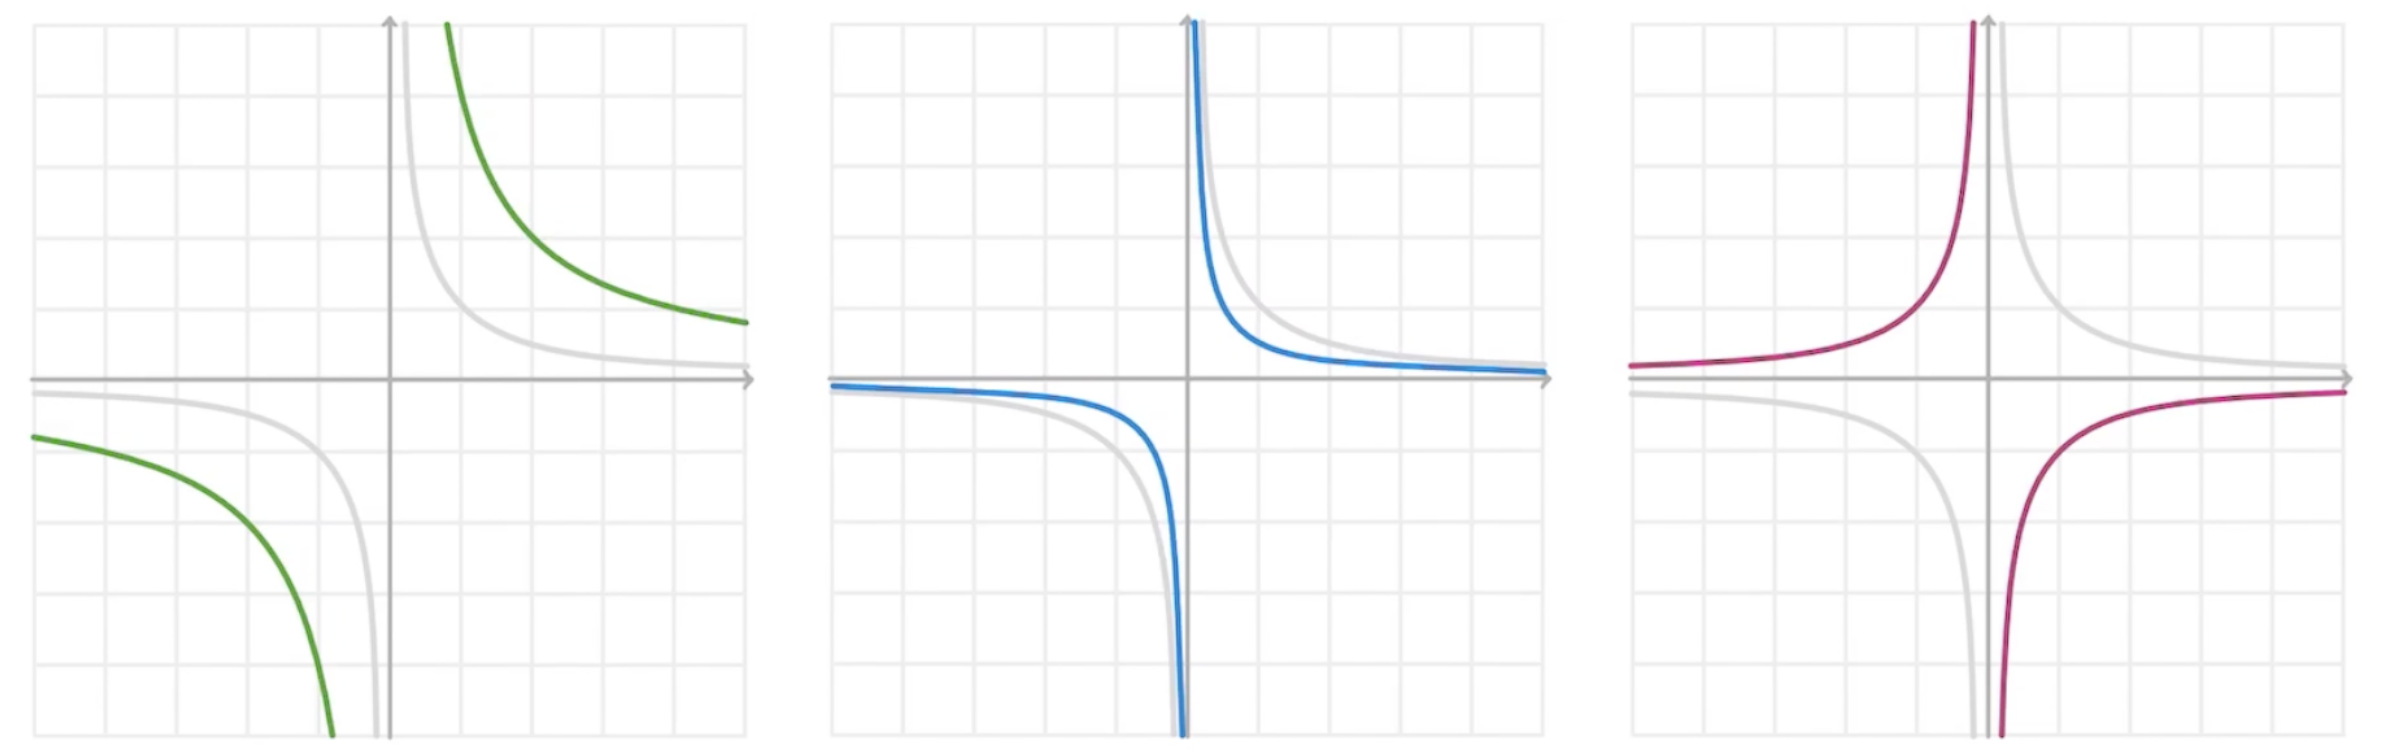
On the graph below, the grey curves represent:
y=x1
Which graph also shows y=−x1?
|