Plotting Straight Lines Using A Table Of Values
This lesson covers:
- How to complete a table of 𝑥 and 𝑦 values for an equation
- How to use a table of values to plot a straight line on a graph
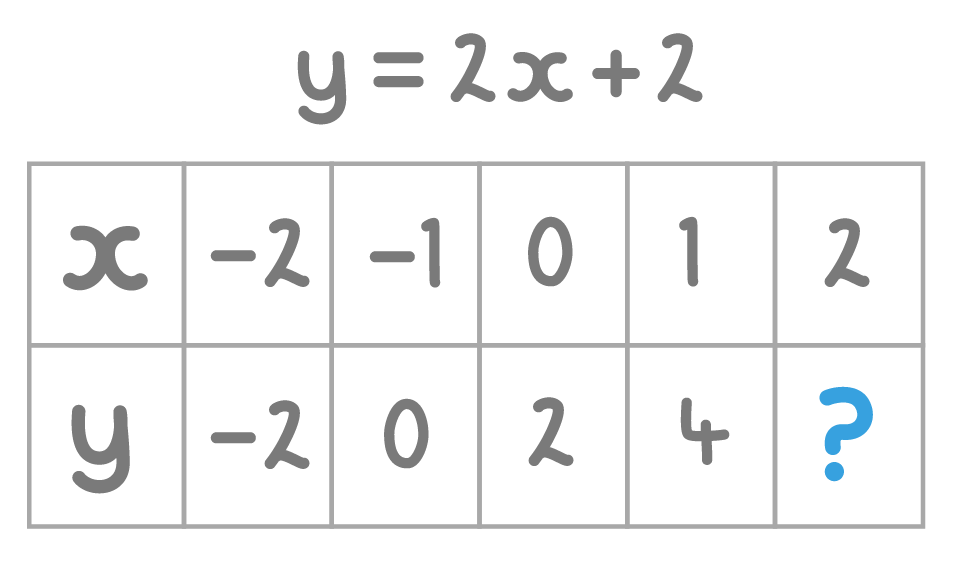
The diagram above shows the table of values for the line 𝑦 = 2𝑥 + 2.
What is the missing value?
|
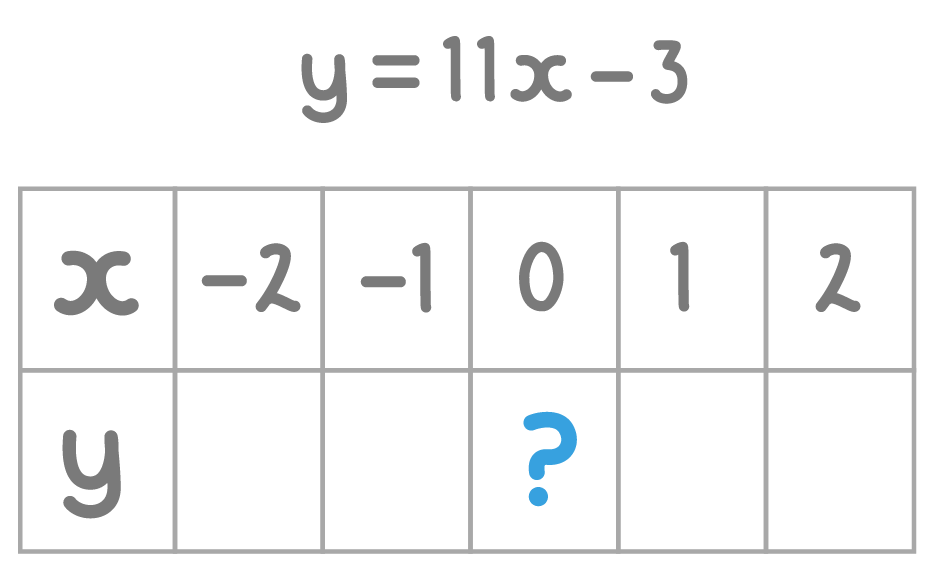
When 𝑥 = 0, 𝑦 = .
|
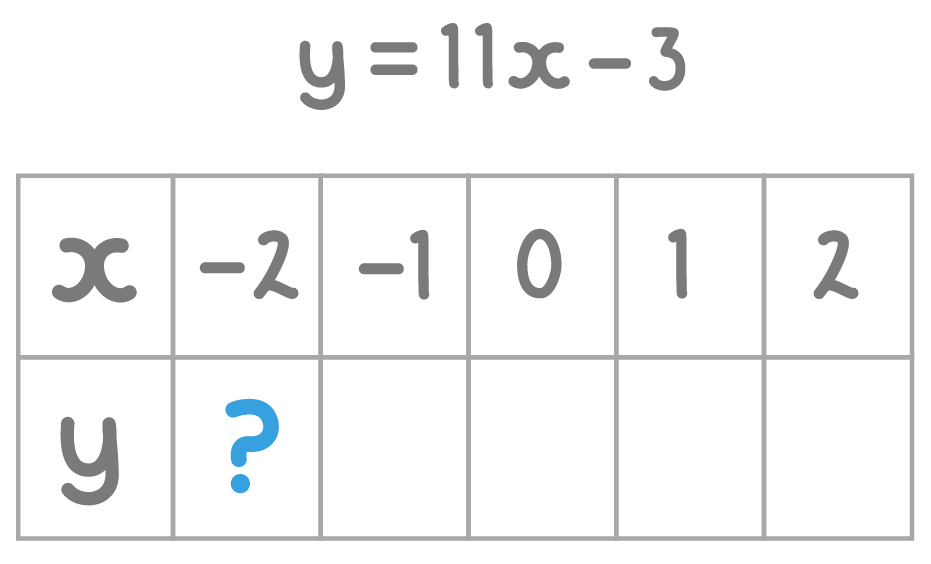
When 𝑥 = -2, 𝑦 = .
|
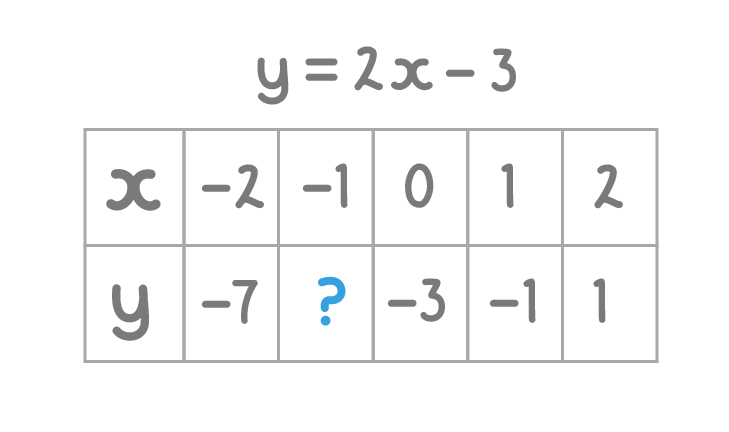 |
When x = -1, y = .
|
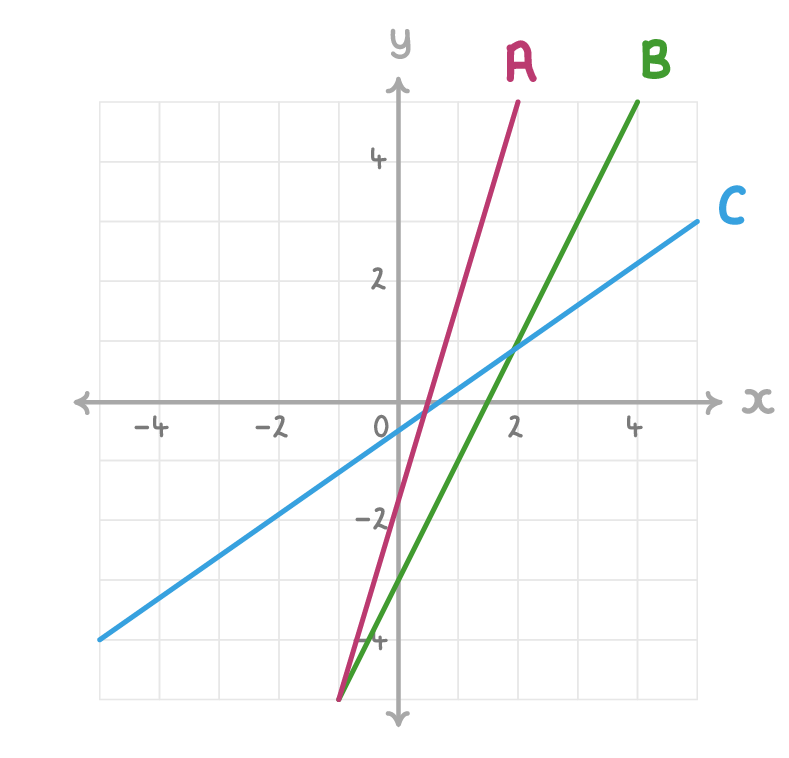 |
If you plotted the table of values above, which of the lines (shown on the graph below) would you get? C B A
|
|
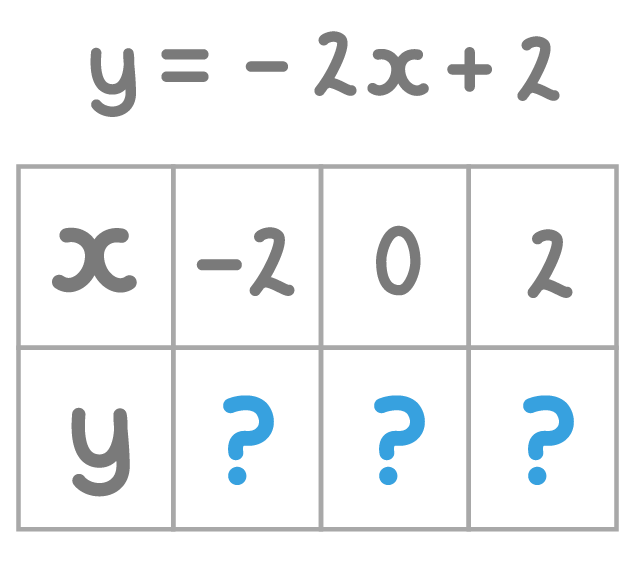 Fill in the missing values from the table above: When 𝑥 = -2, 𝑦 = . When 𝑥 = 0, 𝑦 = . When 𝑥 = 2, 𝑦 = .
|
Using these values, which of the lines on the graph below is the line: 𝑦 = -2𝑥 + 2 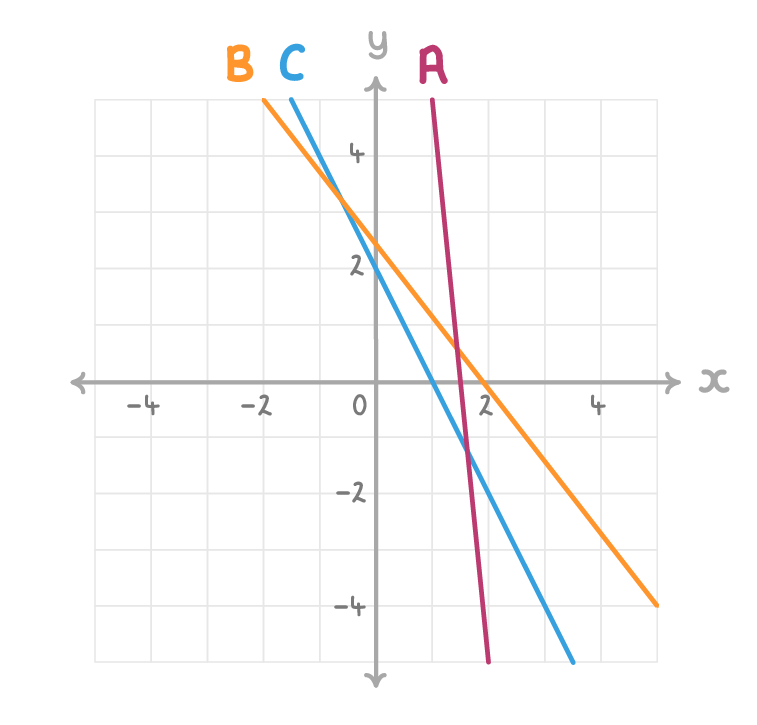 C A B
|
|