Simultaneous Equations - Quadratic Graphs
This lesson covers:
- How to solve simultaneous equations by plotting their graphs
Solving simultaneous equations graphically
To solve simultaneous equations graphically, we plot each equation on the same graph. This might involve rearranging equations into the slope-intercept form, y = mx + c, where m is the gradient and c is the y-intercept. This format makes it easier to identify the slope and y-intercept for graphing.
Steps to solve simultaneous equations graphically:
- Rearrange equations into the form y = mx + c.
- Use a table of values to plot points for each equation. Choosing values for x and then solving for y will give you points through which you can draw your lines.
- Solutions to the simultaneous equations occur where the lines cross.
Worked example 1: Solving simultaneous equations graphically
Solve the following equations graphically:
- y - 2x = 3
- y - 4 = x
Worked example 2: Solving simultaneous equations graphically
Solve the following equations graphically:
- 2x + y = 3
- 4x + y = 7
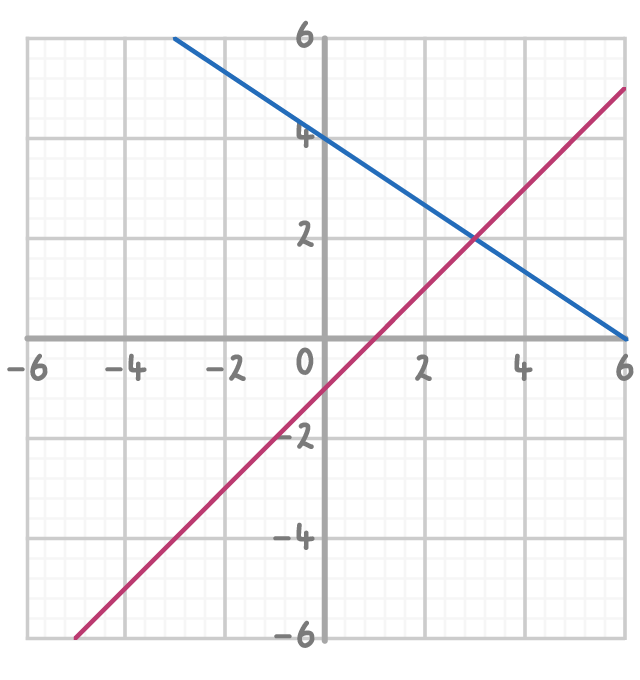
Solve the simultaneous equations by circling the solution on the graph below and writing out the coordinates of the solution.
2x + 3y = 12
x - y = 1
|
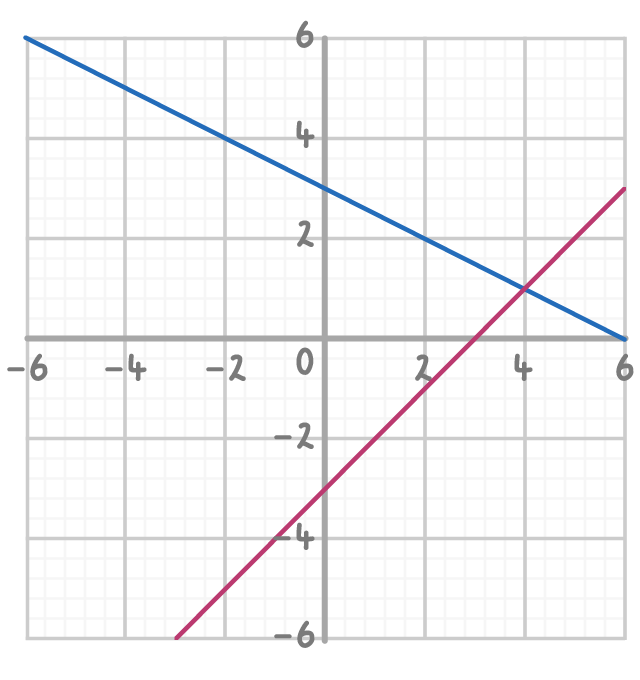
Solve the simultaneous equations by circling the solution on the graph below and writing out the coordinates of the solution.
2x + 4y = 12
x - y = 3
|
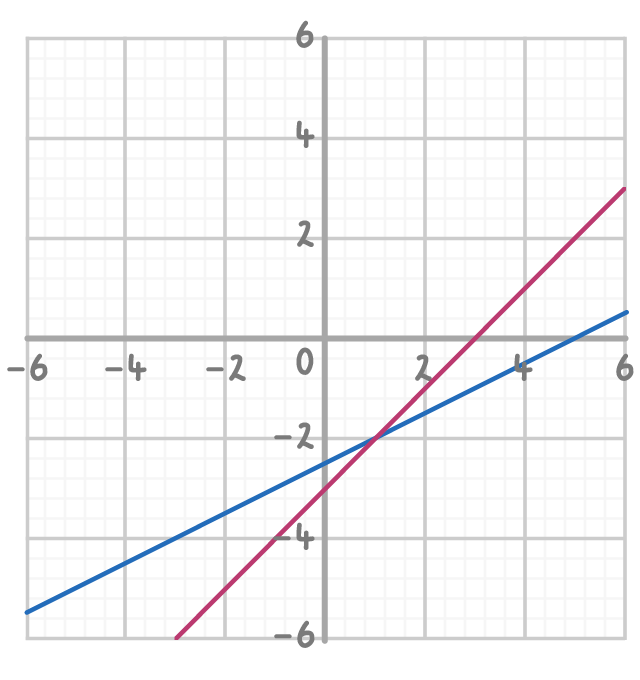
Solve the simultaneous equations by circling the solution on the graph below and writing out the coordinates of the solution.
x - 2y = 5
x - y = 3
|
The diagram shows two straight lines. The equations of the lines are:
y = 2x + 3
y = -32x + 1
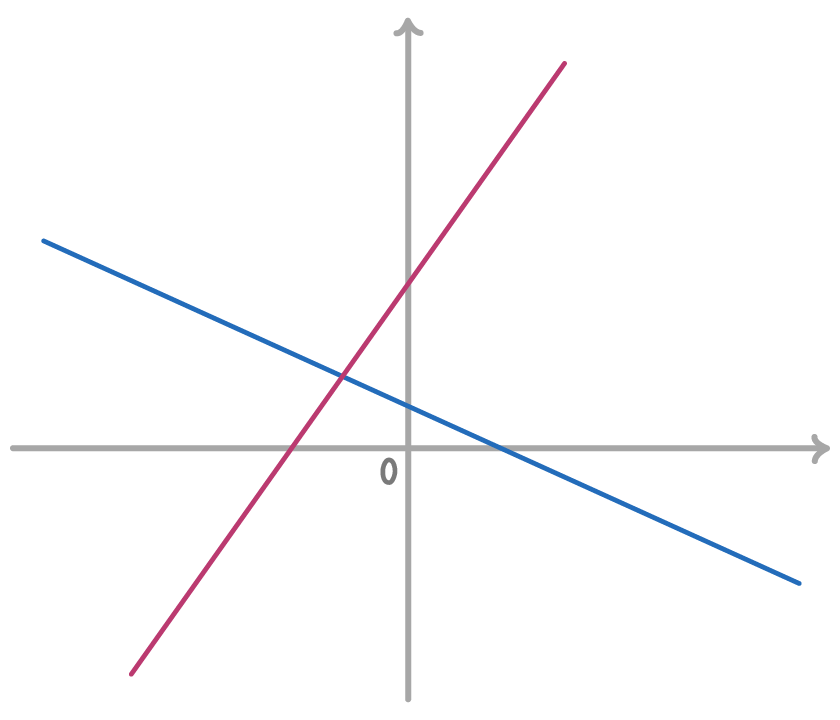
Work out the coordinates of the point where the lines intersect.
|