Box Plots
This lesson covers:
- What a box plot is
- How to draw a box plot using the lowest value, highest value, lower quartile, median, and upper quartile
- How to use a box plot to find the range and interquartile range
Box plots A box plot (sometimes also called a ‘box and whisker plot’) is a visual representation of a set of data.  |
In addition the lowest and highest values in the data set, it also shows the quartiles. Quartiles are the values that divide a list of values into quarters once they've been arranged in ascending order: |
Lower quartile (Q1): One-quarter of the way through the data. |
Median (Q2): Two-quarters (or one-half) way through the data. |
Upper quartile (Q3): Three-quarters of the way through the data. |
Range and interquartile range The range and interquartile range are both measures of the spread of the data (how spread out all the data values are). We can find both using a box plot. 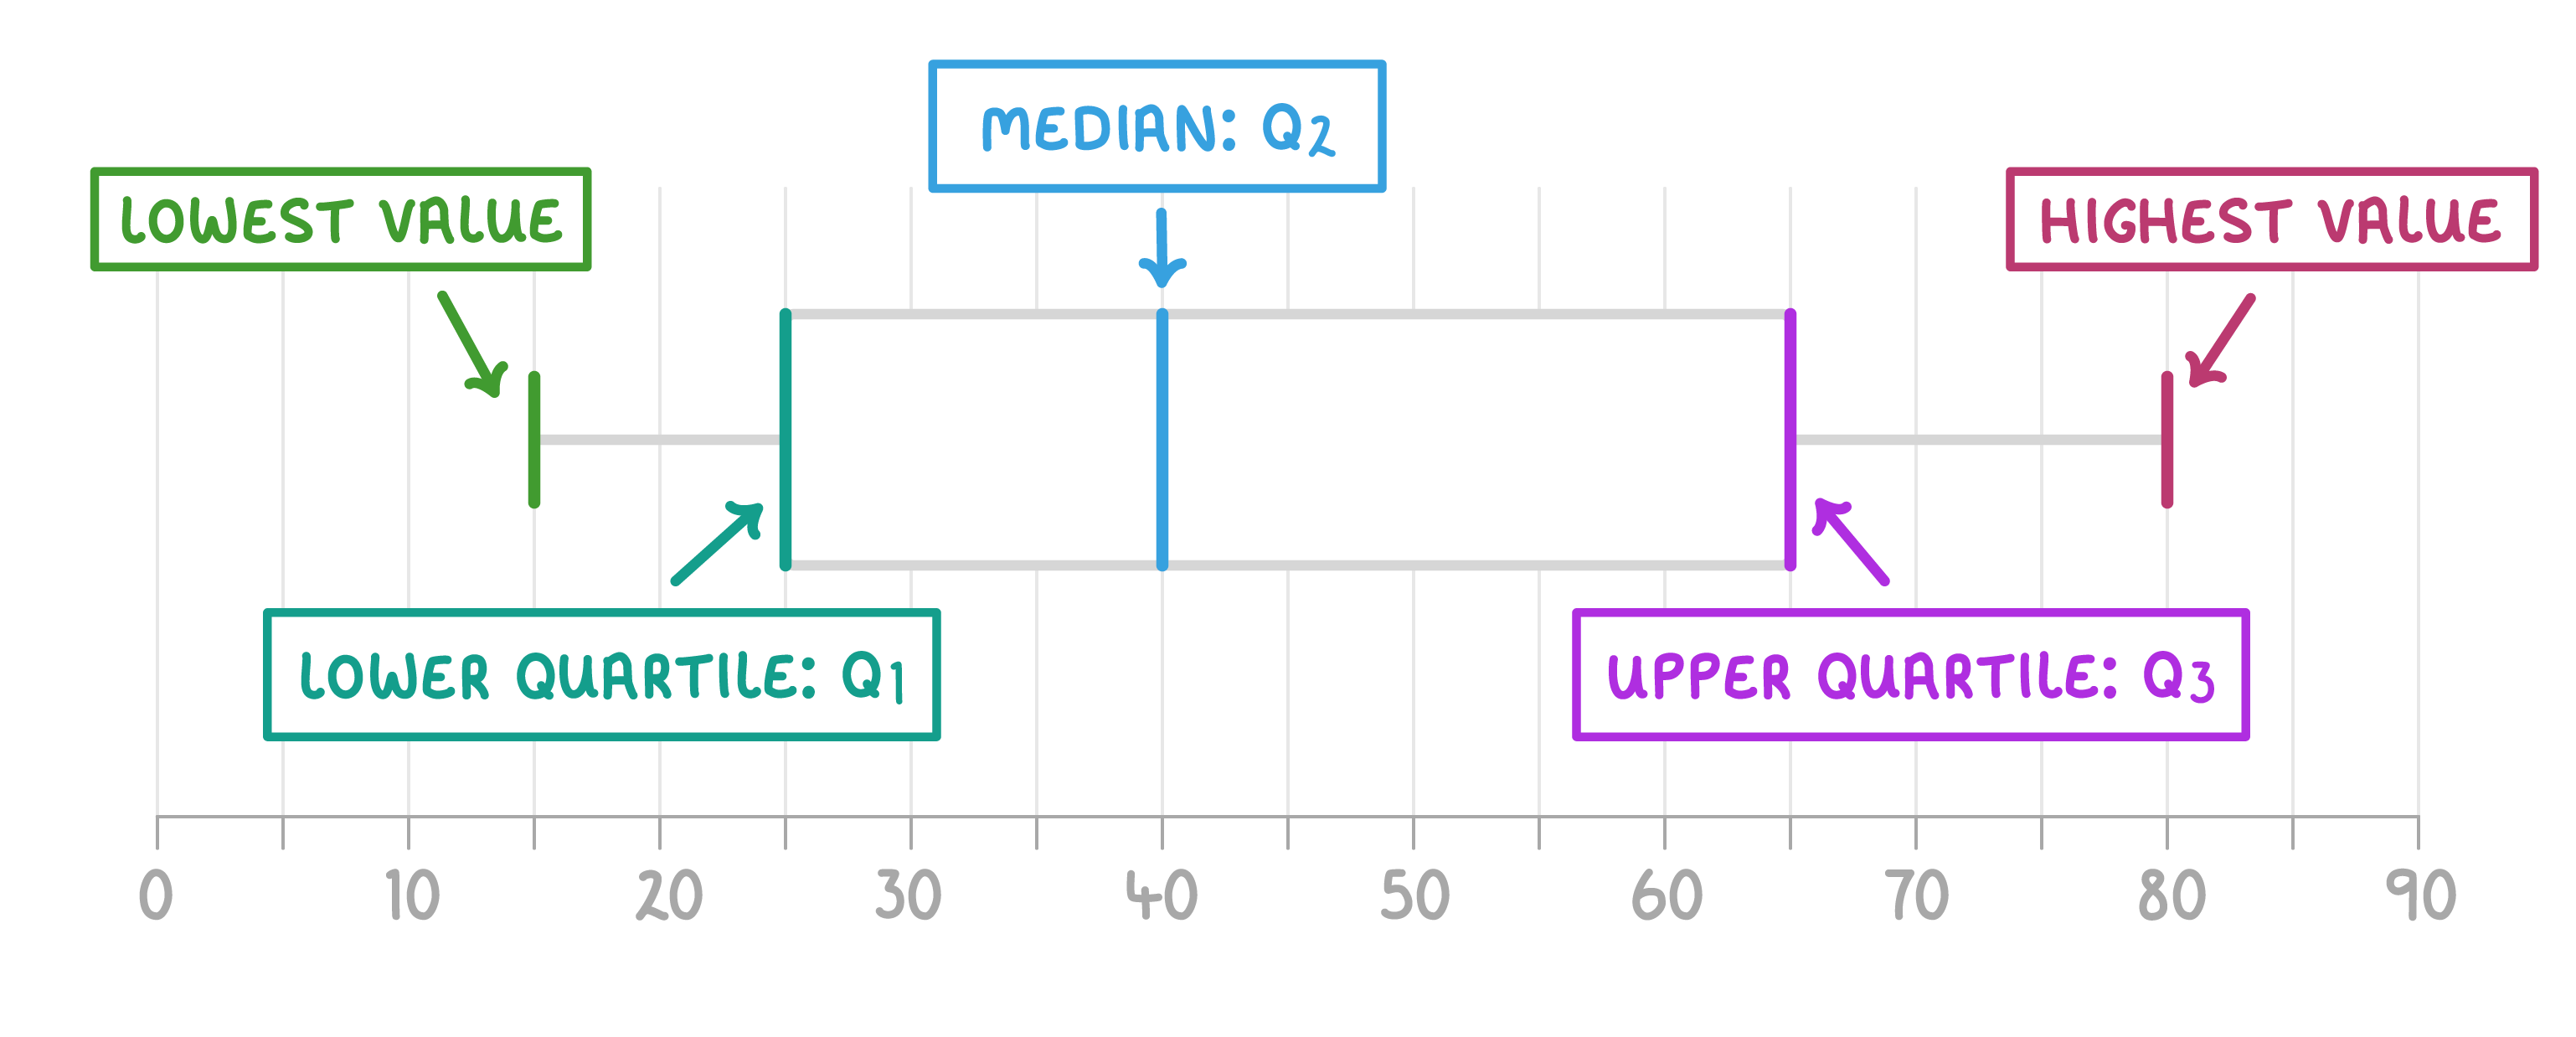 |
Range = highest value - lowest value Range = 80 - 15 = 65 |
Interquartile range (IQR) = upper quartile (Q3) - lower quartile (Q1) Interquartile range (IQR) = 65 - 25 = 40 |
How is the interquartile range (IQR) calculated?
Q3 - Q1
Q2 - Q1
Highest value - lowest value
Q3 + Q1
|
Which of the following represents the median on a box plot?
Q1
Q2
Q3
|
If the lowest value is 15 and the highest value is 80, what is the range?
|