How To Plot Quadratic Graphs
This lesson covers:
- How to use a table of values to plot a quadratic graph from a quadratic equation
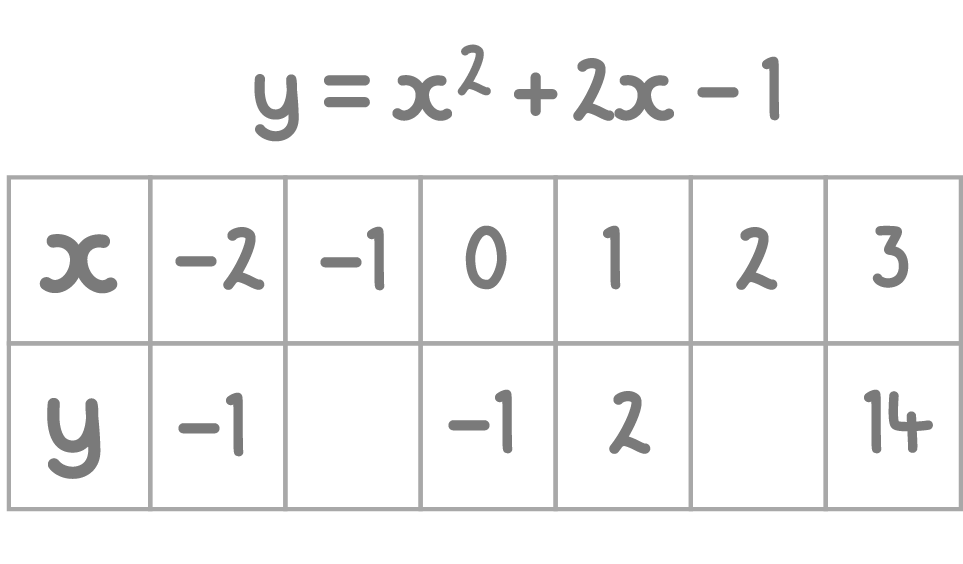
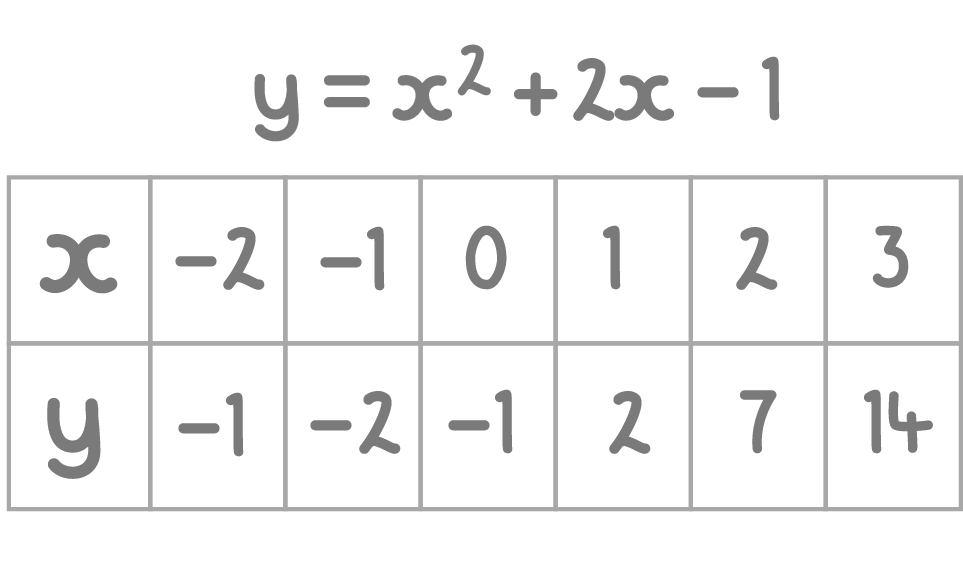
Complete the table below:
(Press 'Continue' to check your answer)
|
By sketching a grid like the one below, use the table of values to draw the graph of:
(Press 'Continue' to check your answer)
|
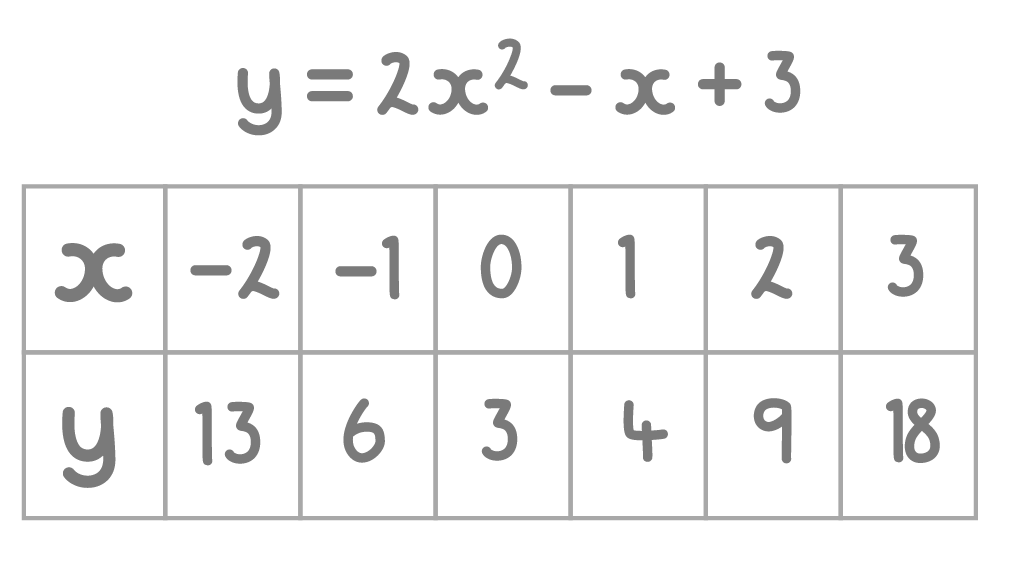
Find a and b to complete the table below for:
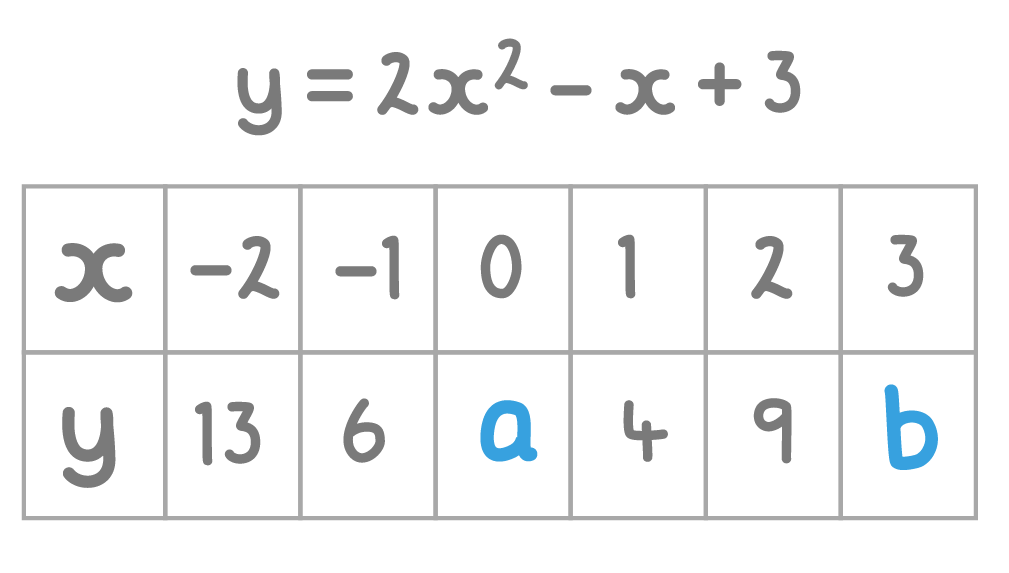
a = , b =
|
By sketching a grid like the one below, use the table of values to draw the graph of:
(Press 'Continue' to check your answer)
|