Graphical Inequalities
This lesson covers:
- How to show inequalities on a graph
- How to find the region on a graph that satisfies multiple inequalities.
When sketching inequalities with < or > signs, such as x < 3, should we use dashed or solid lines?
Solid
Dashed
|
When sketching inequalities with ≤ or ≥ signs, such as y ≥ -6, should we use dashed or solid lines?
Dashed
Solid
|
Which line on the graph below represents the inequality:
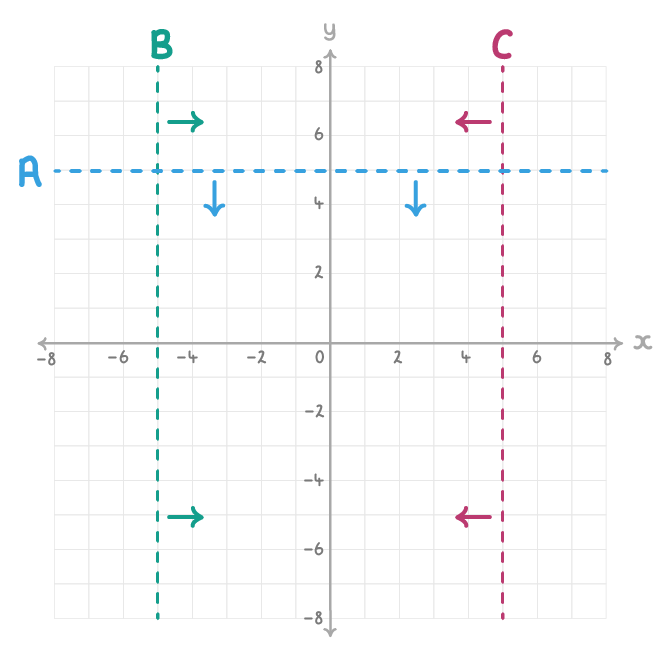
A
C
B
|
Which line on the graph below represents the inequality:
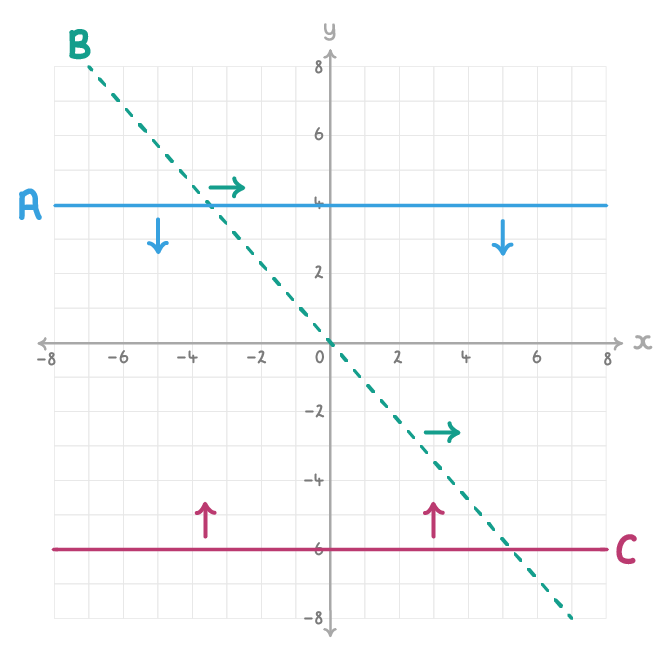
C
A
B
|
Write the inequality that represents the line on the graph below.
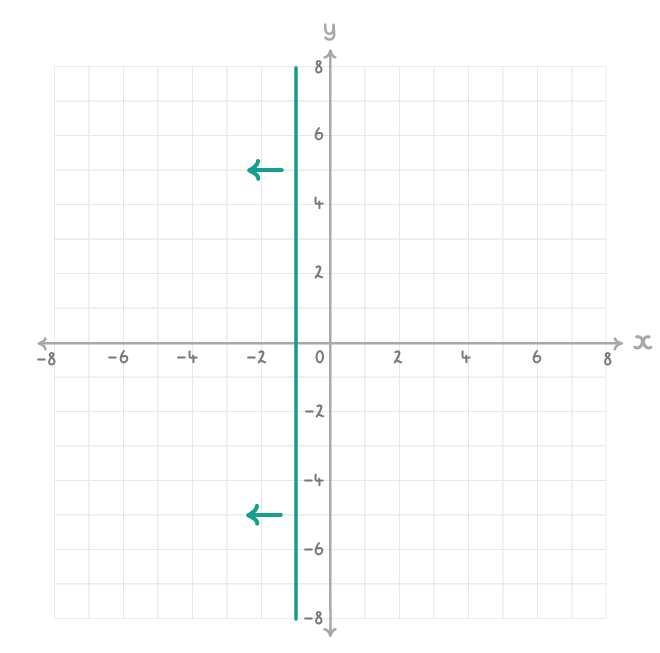
|
Write the inequality that represents the line on the graph below.
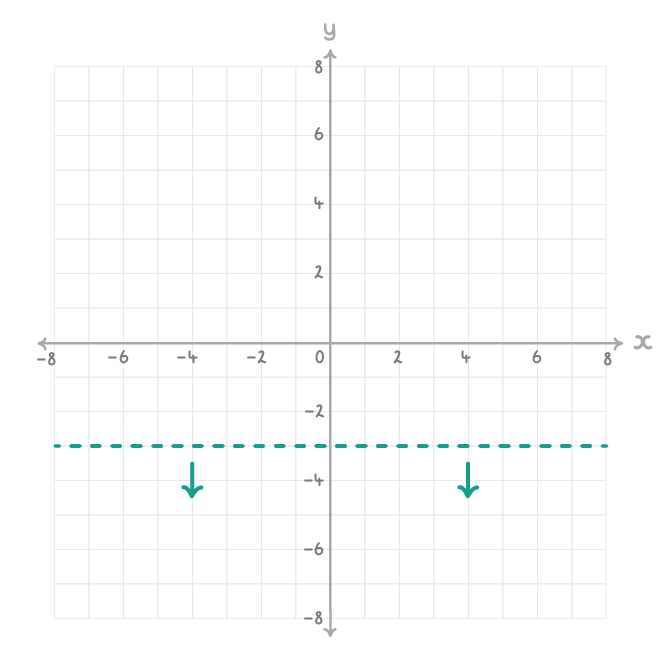
|
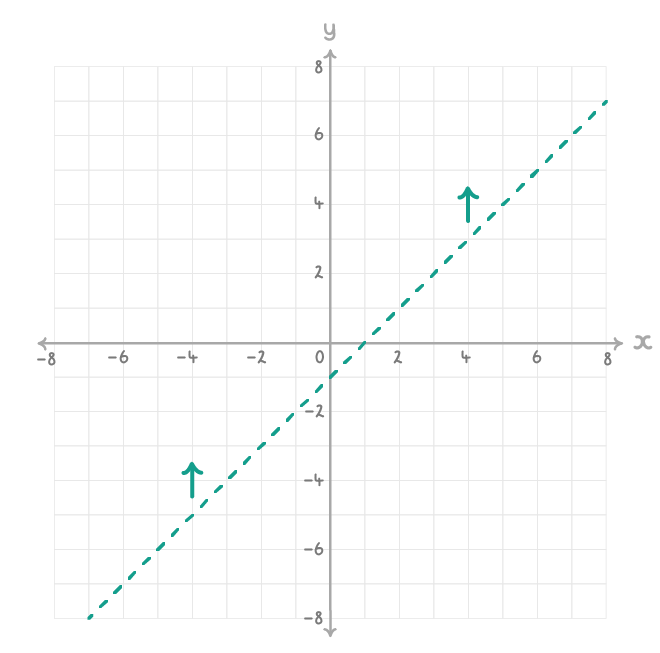
Write the inequality that represents the line on the graph below.
(Tip: Find the equation of the line first)
|
Sketch a graph similar to the one below and shade the region that satisfies all three of these inequalities:
y > -4, x ≤ 5, y < 2x + 2
|