Chromatography
This lesson covers:
- What chromatography is and how it works
- Thin-layer chromatography (TLC)
- Gas chromatography (GC)
Chromatography separates mixtures
Chromatography is a group of laboratory techniques for separating the components of a mixture.
It involves two key elements:
- A mobile phase - A liquid or gas that carries the mixture through a system.
- A stationary phase - A solid or solid-supported liquid that does not move with the mobile phase.
The separation happens because of two main reasons:
- The mobile phase moves mixture components at varying speeds based on their solubility. Components that dissolve more easily move faster.
- The stationary phase holds onto the components differently through a process called adsorption. Components that are adsorbed more strongly move slower.
As a result, mixture components travel at different rates and separate into distinct layers, which can be individually analysed.
You'll learn about two types of chromatography in this lesson:
- Thin-layer chromatography (TLC)
- Gas chromatography (GC)
Thin-layer chromatography of mixtures
Thin-layer chromatography (TLC) is a simple and inexpensive form of chromatography used to analyse mixtures.
How TLC works:
- A stationary phase, typically silica gel or alumina, is spread thinly on a support material like glass or metal.
- A small amount of the mixture to be analysed is applied close to the plate's bottom edge.
- The plate is then placed upright in a sealed container with a small amount of solvent or solvent mixture at the bottom.
- The solvent moves up the plate by capillary action, carrying the mixture components at different rates based on their solubility in the solvent and their affinity for the stationary phase.
- Once the solvent has nearly reached the top, the plate is removed, and the locations of the separated components are marked.
Using Rf values to identify substances:
The retention factor (Rf) value is the ratio of the distance travelled by a component (spot) from the baseline to the distance travelled by the solvent. It is calculated using the following formula:
Rf =distance travelled by soventdistance travelled by spot
These distances are represented on the chromatogram below.
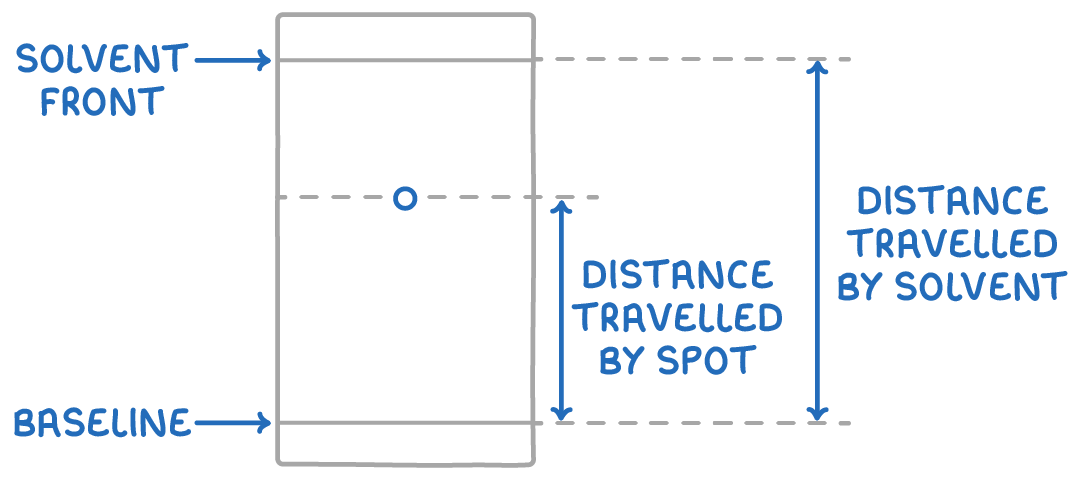
Rf values range from 0 to 1 and can help identify compounds based on their movement under specific conditions. Comparing the Rf values of unknown substances to those of known compounds, under the same conditions, can reveal their identities.
Gas chromatography of volatile liquids
Gas chromatography (GC) separates volatile liquid mixtures into individual substances.
How gas chromatography works:
- A liquid sample is vaporised in a heated chamber.
- An inert carrier gas then transports the vaporized sample through a chromatographic column containing the stationary phase, consisting of a non-polar high boiling liquid absorbed onto a solid support.
- The column has a stationary phase that interacts differently with each component of the sample.
- Components are separated based on how they partition between the mobile gas phase and the stationary phase.
- As they exit the column, a detector records the separation, producing a chromatogram with distinct peaks for each component.
Analysing gas chromatograms
Gas chromatograms display peaks that represent different substances in a mixture. The position of each peak is determined by its retention time, which is the time taken for the corresponding substance to travel through the chromatographic column. To identify the substances in the mixture, compare the retention times of the peaks with those of known standards.
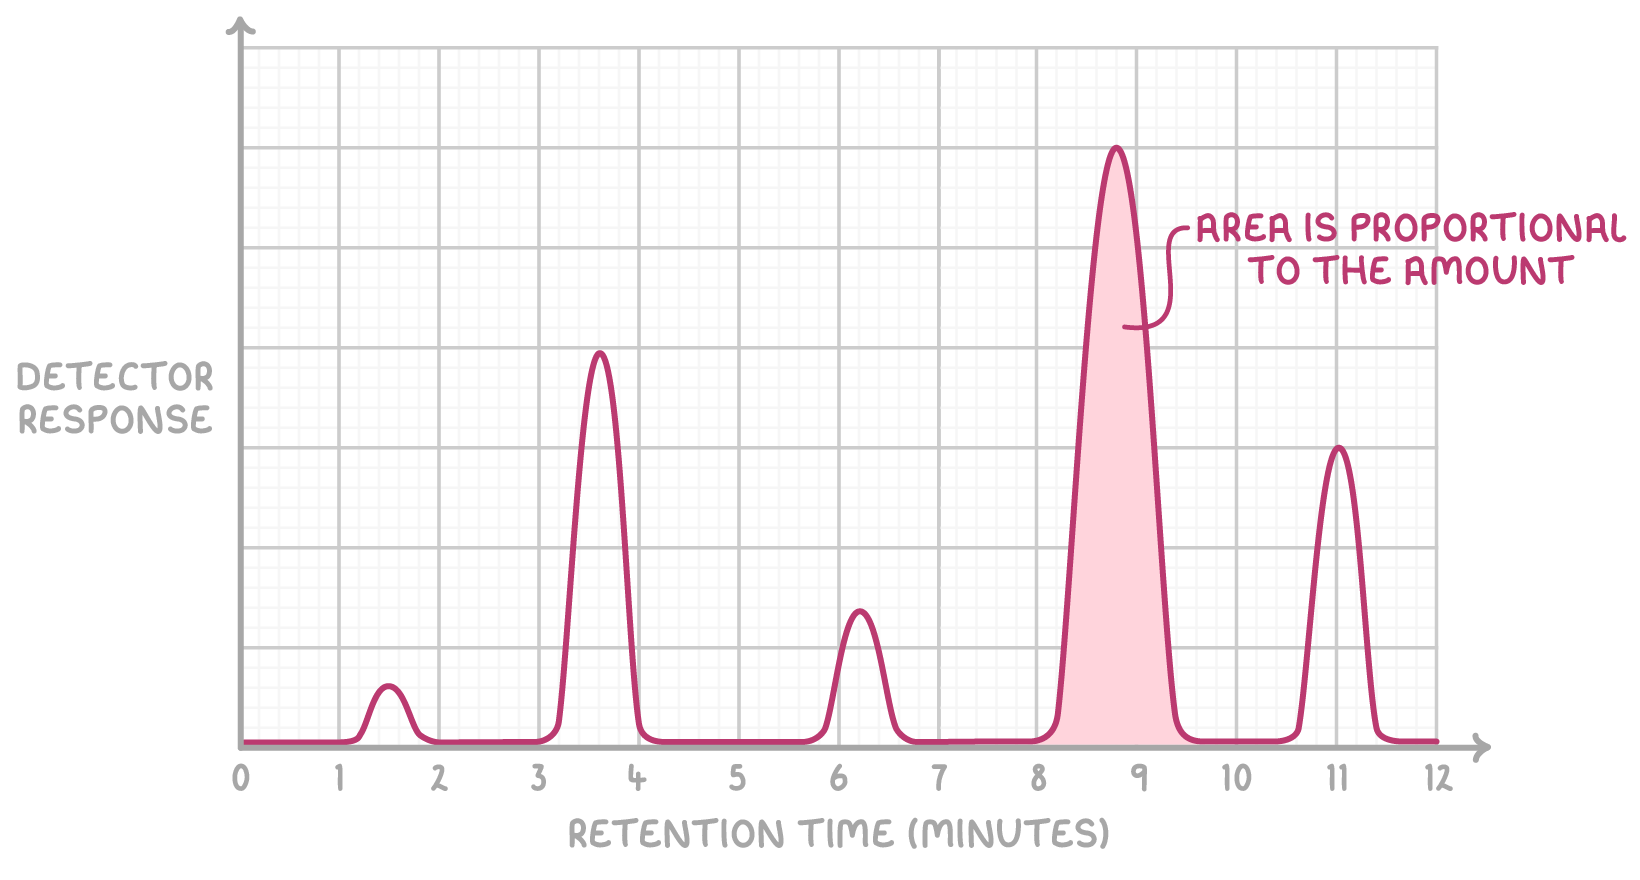
The area under each peak is proportional to the amount of the corresponding substance in the mixture. To calculate the percentage composition of a substance, find the area under its peak and express it as a percentage of the total area under all peaks.