The Effect of Temperature on Rate of Reaction
This lesson covers:
- The kinetic energy distribution of gas molecules
- Maxwell-Boltzmann distribution curves
- How temperature affects the kinetic energy of gas molecules
Kinetic energy distribution in gases
Gas molecules have varying kinetic energies, which is why they move at different speeds. This variation can be represented through a Maxwell-Boltzmann distribution curve.
- Some molecules move slowly because they have low kinetic energy.
- Others move very fast due to their high kinetic energy.
- The majority of molecules, however, have moderate kinetic energies and speeds.
- Only molecules with kinetic energies greater than or equal to the activation energy have sufficient energy to react when they collide.
Features of the Maxwell-Boltzmann distribution
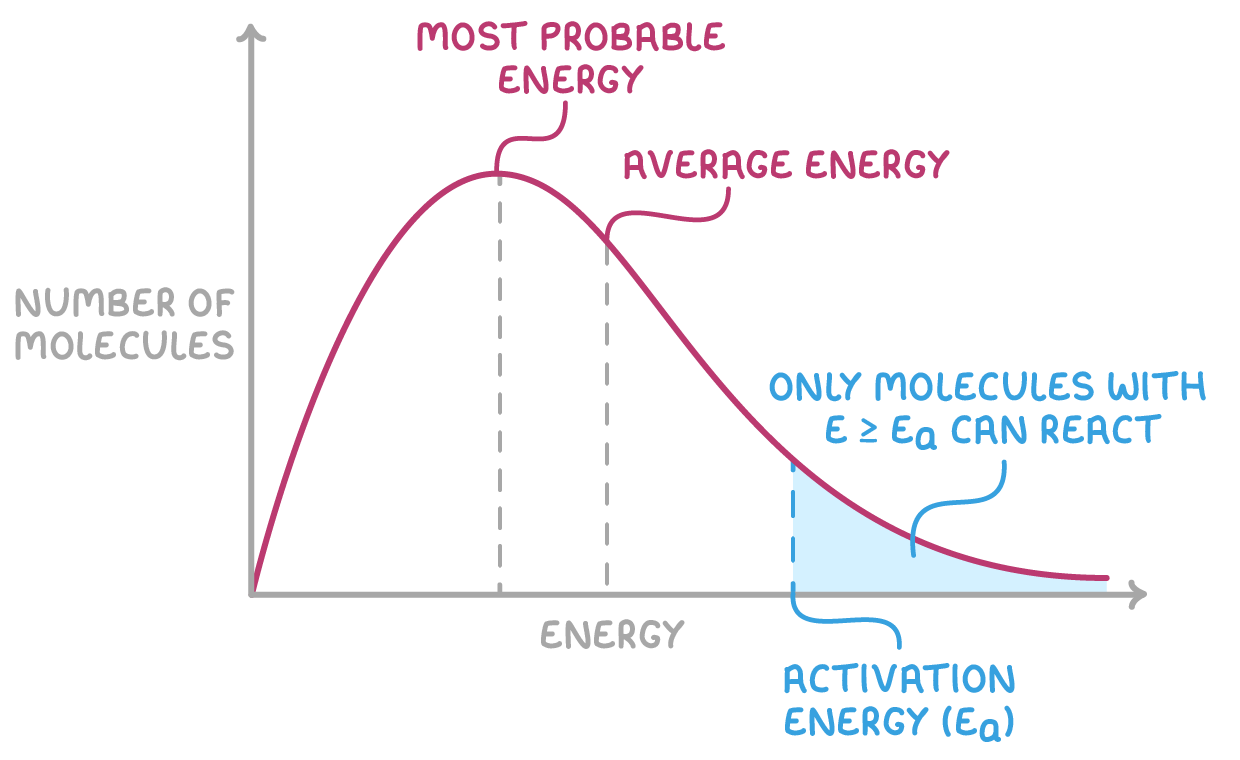
The Maxwell-Boltzmann distribution curve is characterised by several key features:
- The curve originates at the origin, indicating that no molecules have zero kinetic energy.
- It rises sharply to a peak that represents the most common kinetic energy level among the molecules, before gradually decreasing.
- The total area under the curve is equivalent to the total number of molecules.
- The peak of the curve shows the most probable kinetic energy a single molecule can have.
- On average, the kinetic energy of all molecules is a bit higher than the peak energy.
Increasing temperature shifts the curve
When the temperature increases, it affects the kinetic energy distribution:
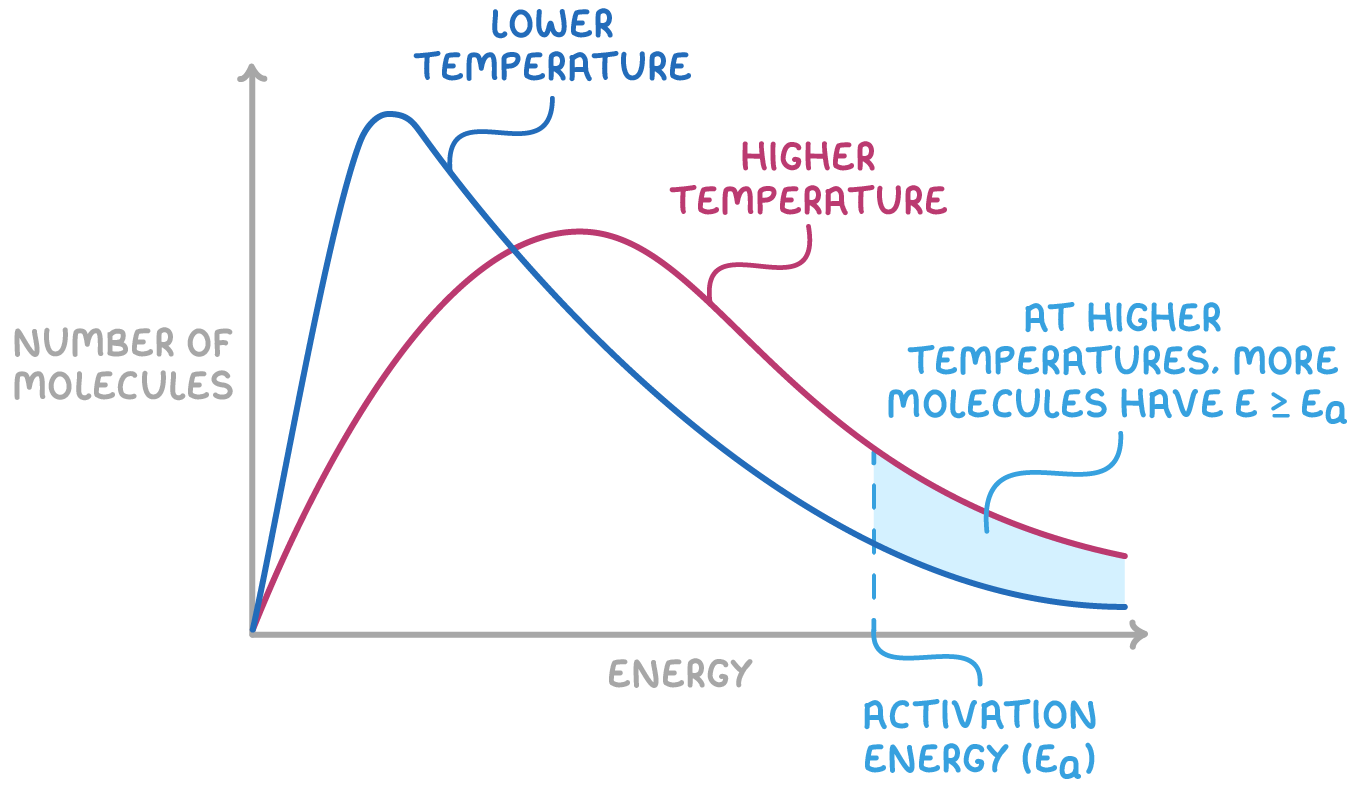
- As the temperature rises, a greater number of molecules attain the kinetic energy necessary to surpass the activation energy, leading to a reaction.
- Consequently, the distribution curve shifts to the right, indicating that more molecules have acquired sufficient kinetic energy.
- Despite the total number of molecules remaining constant, the area under both curves is unchanged, which results in a lower peak height. This is because the distribution of kinetic energies broadens at higher temperatures.
This shift in the distribution curve signifies that both the frequency of collisions and the proportion of effective collisions increase with temperature. Therefore, even a modest rise in temperature can lead to a significant increase in the rate of reaction.