Coloured Ions
This lesson covers:
- How ligands split the energy levels of transition metal ions
- Why transition metal complexes have distinctive colours
- Factors affecting the colour of transition metal ions
- How spectroscopy can determine the concentration of transition metal ions
Ligands split the 3d orbitals into two energy levels
When ligands bond to transition metal ions, they split the energies of the 3d orbitals into two levels:
- Normally, all the 3d orbitals have equal energy and are said to be degenerate. Degenerate orbitals are orbitals that have the same energy level.
- Bonding to the ligands raises the energy of some of the orbitals, making them non-degenerate. Non-degenerate orbitals are orbitals that have different energy levels.
- This splits them into a ground state (lower energy) and an excited state (higher energy).
In octahedral complexes such as [Cu(H2O)6]2+, three d-orbitals have a lower energy and two d-orbitals have a higher energy.
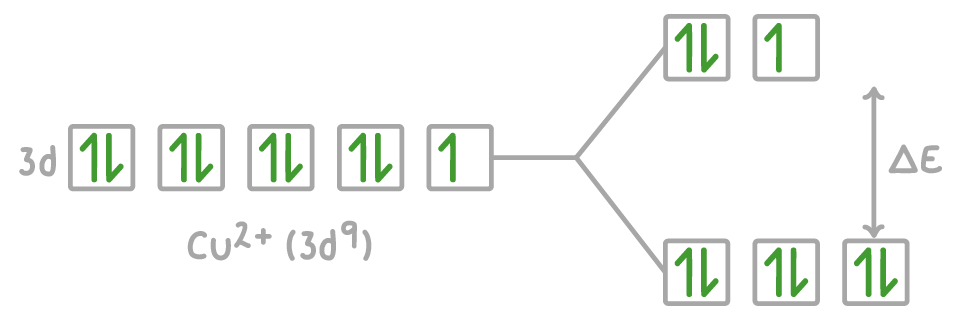
For an electron to jump from the ground state to the excited state, it needs an energy input equal to the energy gap (ΔE) between the two states.
The 4 factors that affect the energy gap (ΔE)
The energy gap, ΔE, depends on the following factors:
- Identity of the central transition metal ion
- Oxidation state of the ion
- Identity of the ligands
- Coordination number
Changing these factors will change the colour of the complex ion, for example:
- Change in central ion - e.g., [Co(H2O)6]2+ is pink whereas [Cu(H2O)6]2+ is pale blue.
- Change in oxidation state - e.g., [V(H2O)6]2+ is violet whereas [V(H2O)6]3+ is green.
- Change in ligands - e.g., [Co(H2O)6]2+ is pink whereas [Co(NH3)6]2+ is brown.
- Change in coordination number - e.g., [Co(H2O)6]2+ is pink whereas [CoCl4]2- is blue.
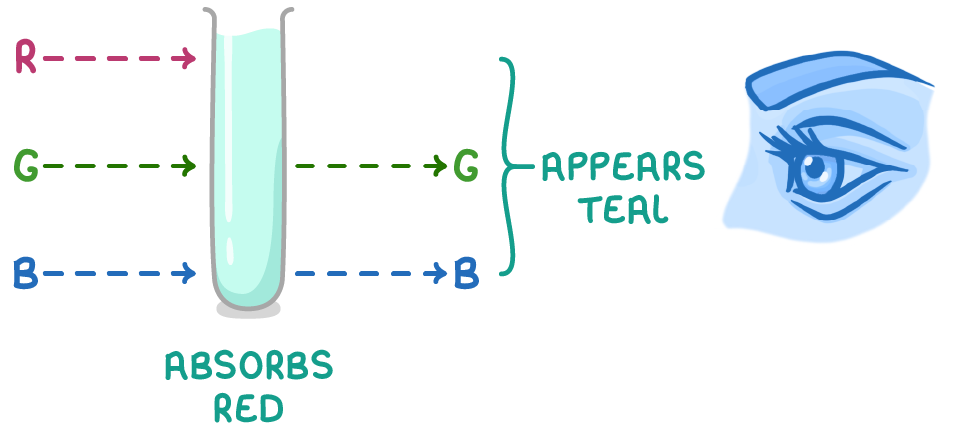
Reflected and transmitted light combine to give the colour
- White light consists of a spectrum of wavelengths from short (violet light) to long (red light).
- When this light hits the complex ion, electrons can jump from ground to excited states by absorbing specific wavelengths of light with energy equal to ΔE.
- The remaining wavelengths of light pass are transmitted or reflected by the complex.
- The transmitted or reflected wavelengths combine to form the colour we actually see for the complex ion.
- This colour is the complementary colour to the wavelengths absorbed.
In the case of [Cu(H2O)6]2+, the complex absorbs red light, and the transmitted frequencies combine to give cyan, the complementary colour to red. As a result, the solution appears teal, a blue-green shade of cyan.
The equation that links the energy gap (ΔE) to the wavelength of light absorbed (λ) is:
ΔE=λhc
Where:
- ΔE = energy gap between ground and excited states (J)
- h = Planck’s constant (6.63 × 10⁻³⁴ J s)
- c = speed of light in a vacuum (3.00 × 10⁸ m s-1)
- λ = wavelength (m)
Alternatively, the energy gap can be related to the frequency (ν) of the absorbed light using the equation:
ΔE=hν
Where ν is the frequency of the absorbed light (s-1 or Hz).
According to this equation, smaller energy gaps correspond to longer wavelengths of light being absorbed.
Worked example 1 - Calculating wavelength of light absorbed
Calculate the wavelength of light (in nm) absorbed by a transition metal complex with an energy gap of 2.50 × 10⁻¹⁹ J.
Planck's constant, h = 6.63 x 10⁻³⁴ J s.
Speed of light in a vacuum, c = 3.00 x 10⁸ m s-1.
Step 1: Equation
ΔE=λhc
Step 2: Rearrange the equation
λ=ΔEhc
Step 3: Substitution and correct evaluation
λ=(2.50×10⁻¹⁹)(6.63×10−34)×(3.00×108)=7.96×10⁻⁷ m
Step 4: Conversion of m into nm
To convert from m into nm, multiply by 109
7.96×10⁻⁷ m=796 nm
Colorimetry determines concentration of complex ions
Colorimetry uses light absorption to quantify the concentration of coloured transition metal solutions.
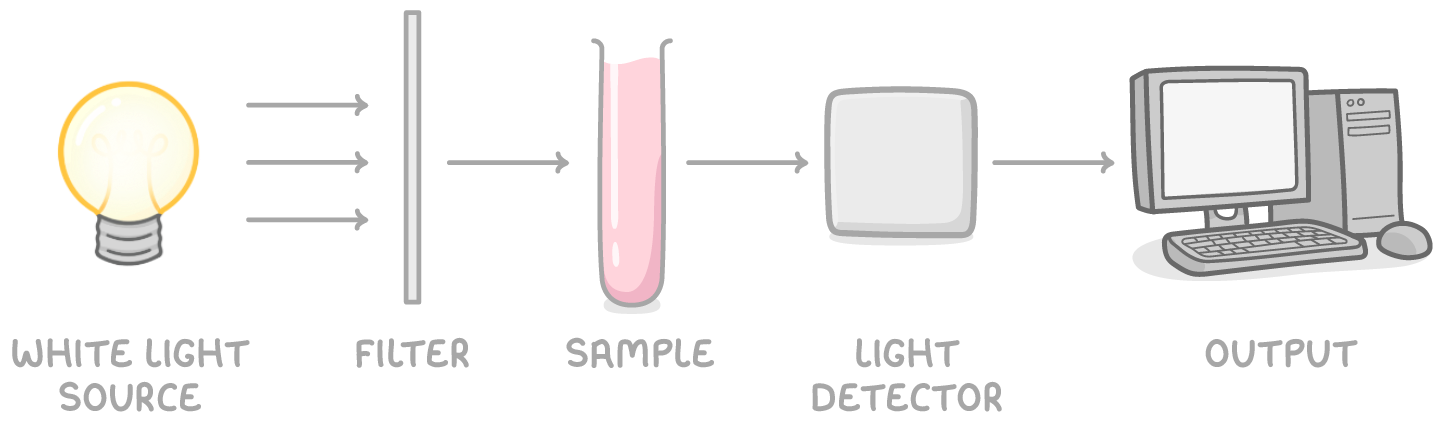
The steps to determine an unknown concentration are:
- Calibration solutions with a range of known concentrations of the coloured metal ion are prepared.
- The absorption of a specific filtered wavelength is measured for each standard solution using a colorimeter
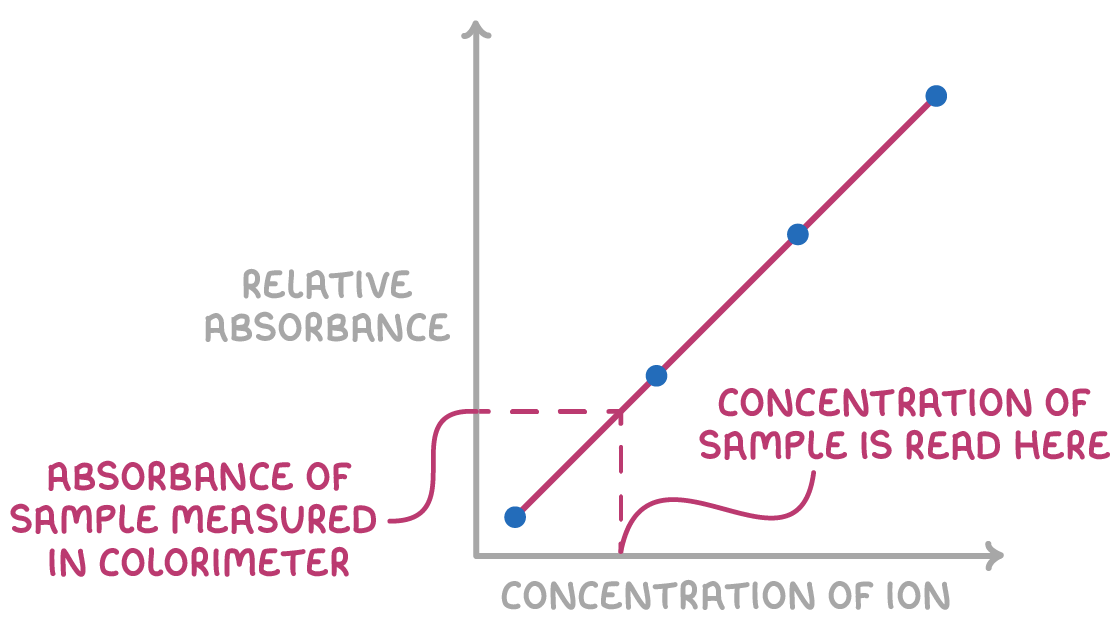
- These data points of known concentration vs absorbance are plotted to create a calibration curve.
- The coloured sample of unknown concentration then has its absorption measured.
- The absorbance of the unknown sample is compared to the graphed calibration curve.
- Based on where its absorption falls compared to those of the standards, the actual concentration can be determined from the curve.