Infrared Spectroscopy
This lesson covers:
- The basic principles of infrared spectroscopy
- The fingerprint region
- Real world applications of infrared spectroscopy
- Infrared spectroscopy and global warming
Infrared radiation is absorbed by covalent bonds
Infrared (IR) spectroscopy takes advantage of the fact that covalent bonds in molecules can vibrate at specific natural frequencies. An infrared spectrometer passes IR radiation through a sample. When the IR frequency matches the natural frequency of a certain covalent bond, that bond absorbs the radiation.
Different bonds, in different environments, absorb at different frequencies. By detecting which frequencies are absorbed, an IR spectrometer produces a spectrum showing the frequencies and intensity of IR radiation absorbed.
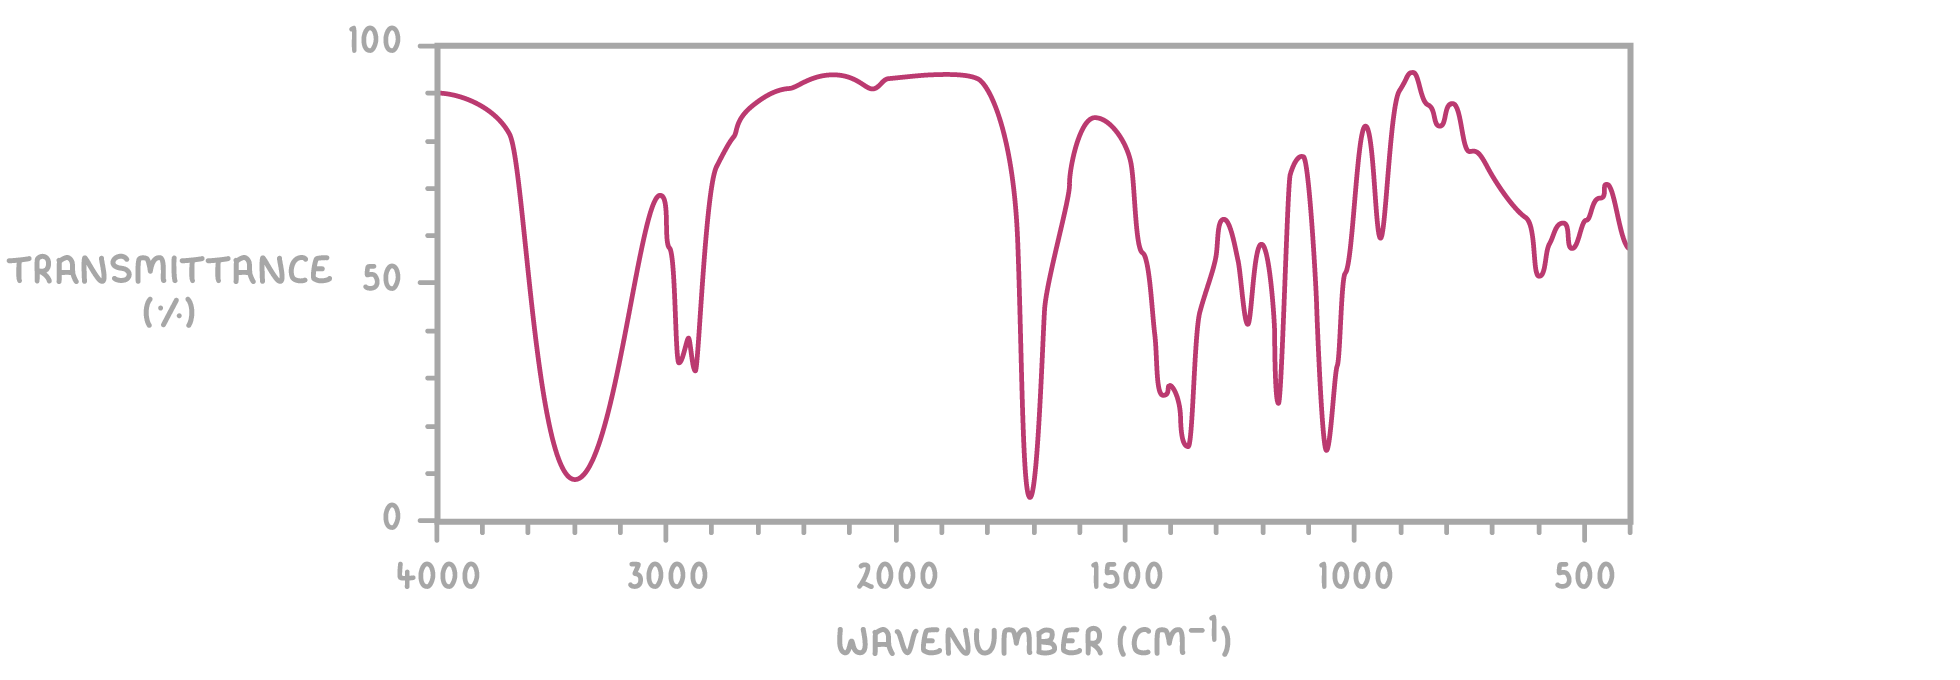
The ‘peaks’ point downwards because they show you where radiation is being absorbed.
Identifying functional groups
Covalent bonds absorb IR radiation at characteristic frequencies. These are expressed in terms of wavenumber which is inversely proportional to wavelength. The table below lists various functional groups along with the wavenumber ranges at which they absorb IR radiation.
You do not need to memorise this data but you do need to know understand how to use it.
| Bond | Functional group | Wavenumber range (cm-1) |
|---|---|---|
| N-H | Amines | 3,300 - 3,500 |
| O-H | Alcohols | 3,300 - 3,600 |
| O-H | Carboxylic acids | 2,400 - 3,300 |
| C-H | Most organic molecules | 2,800 - 3,000 |
| C≡N | Nitriles | 2,200 - 2,300 |
| C=O | Aldehydes, ketones, carboxylic acids, esters | 1,650 - 1,850 |
| C=C | Alkenes | 1,650 - 2,000 |
| C-O | Alcohols, carboxylic acids | 1,000 - 1,300 |
By identifying which frequencies have been absorbed, the functional groups (or bonds) in an organic molecule can be deduced from its IR spectrum.
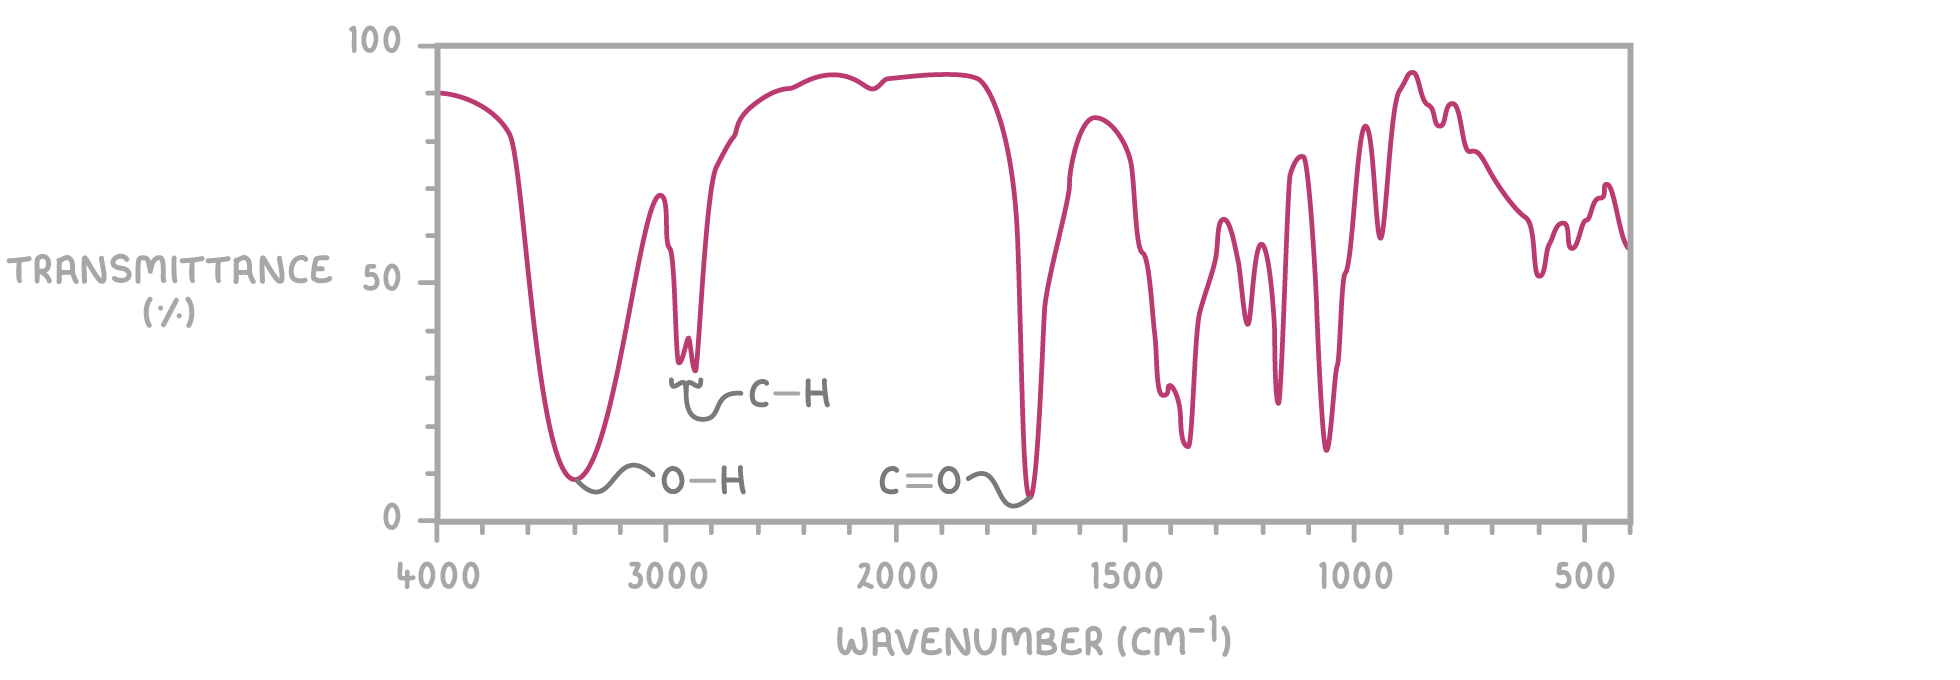
For example, the IR spectrum of 4-hydroxybutanone displays characteristic peaks corresponding to O-H, C-H, and C=O bonds, as shown above.
The fingerprint region
The section of an IR spectrum from 500 - 1,500 cm-1 is called the fingerprint region. This region produces a pattern unique to each different molecule.
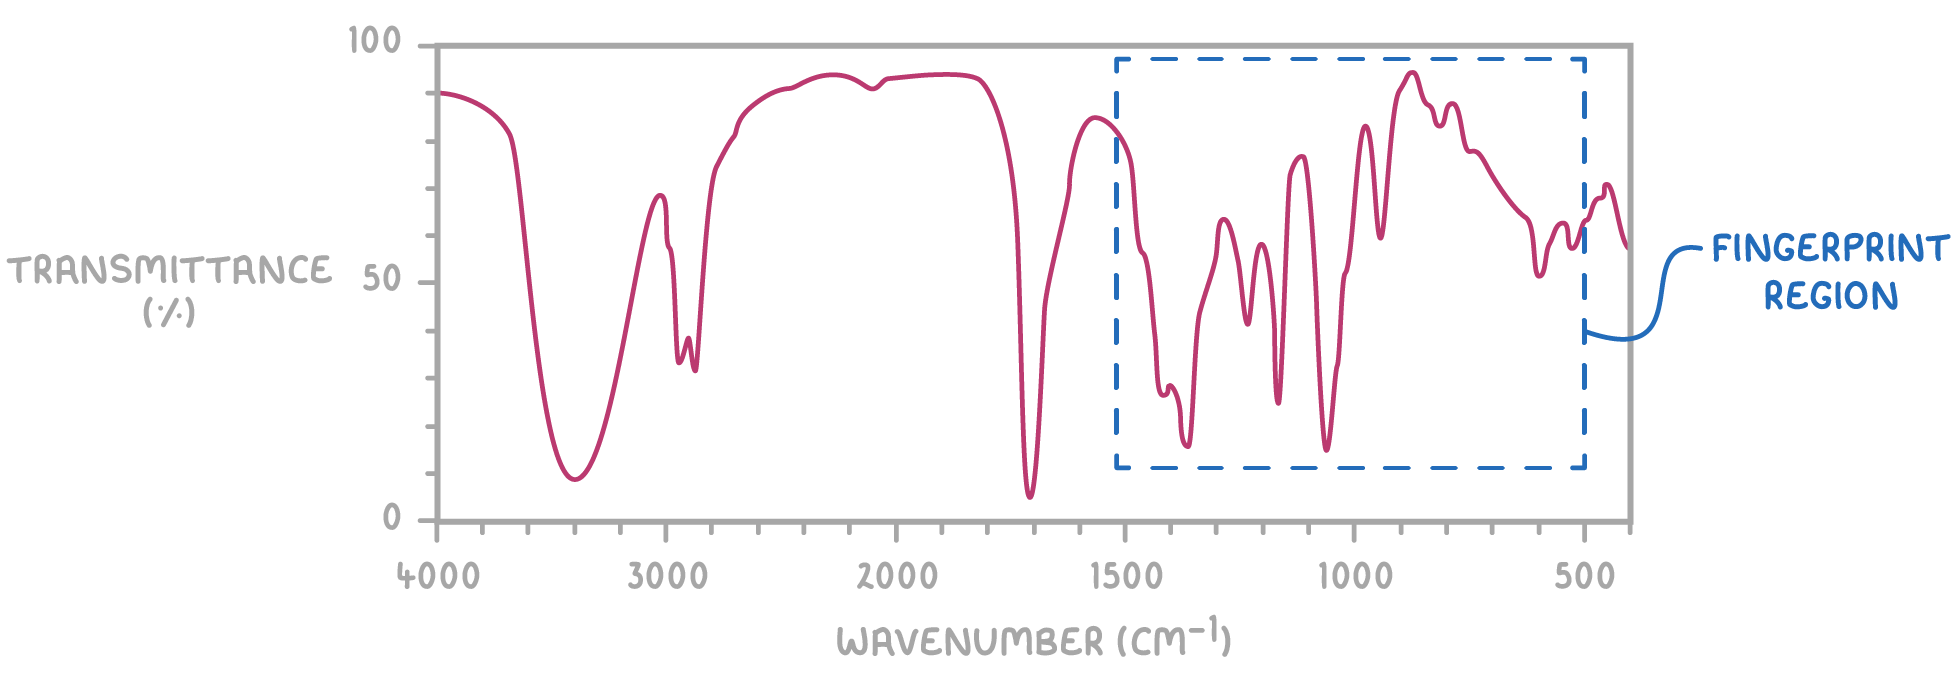
An unknown compound can be identified by matching its fingerprint region to reference spectra in a database. If the patterns match it is the same molecule.
Extra peaks in the fingerprint region indicate sample impurities are present. IR spectroscopy is thus valuable for checking compound purity.
Uses of infrared spectroscopy
Infrared spectroscopy has many uses including:
- Breathalyser tests - The intensity of ethanol's C-H peak indicates how much is present in a person's breath. This reveals if a driver is over the legal alcohol limit.
- Atmospheric monitoring - Peak intensities for gases like CO and NO show pollutant levels from car emissions and industrial processes.
Infrared absorption links to the greenhouse effect
Infrared spectroscopy has furthered scientific understanding of the greenhouse effect and global warming.
The principles are:
- Some incoming solar radiation is absorbed by the Earth then re-emitted as longer-wavelength infrared radiation (heat).
- Greenhouse gases like carbon dioxide, methane and water vapor in the atmosphere absorb this infrared radiation through their covalent bonds.
- These gases then re-radiate some heat back to Earth, warming the surface temperature - the natural greenhouse effect.
Human activities leading to rising greenhouse gas levels amplify this effect. More infrared radiation gets absorbed, meaning increased atmospheric and Earth surface temperatures – global warming.
Infrared spectroscopy allows precise measurement of changing greenhouse gas concentrations over time by tracking the infrared absorption intensities of their characteristic covalent bonds:
- The C=O bond of carbon dioxide
- The C-H bond of methane
- The O-H bond of water vapour
So infrared spectroscopy studies provide critical data demonstrating human activity is increasing the greenhouse effect and causing escalating global temperatures.