Mass Spectrometry
This lesson covers:
- How mass spectrometry works to produce mass spectra
- Using molecular ion and fragmentation peaks to determine molecular mass and structure
- Differentiating compounds using fragmentation patterns
- Differentiating compounds using high resolution mass spectrometry
Mass spectrometers produce mass spectra
Mass spectrometry involves bombarding vaporised sample molecules with electrons, resulting in the production of charged fragments. These fragments are then separated based on their mass-to-charge ratio (m/z) and detected to create a mass spectrum.
Here are the key steps:
- The sample is vaporised, turning it into a gas.
- An electron beam bombards the gaseous molecules, knocking out an electron to form molecular ions (M+).
- Some of these molecular ions break apart into smaller fragment ions.
- The ions are then deflected through a magnetic field, which separates them according to their mass/charge ratio (m/z).
- Finally, the separated ions are detected and their data is displayed as a mass spectrum.
A mass spectrum represents the abundance of each fragment against its m/z value, providing critical information about the sample's composition.
Molecular ion (M) peak indicates molecular mass
The molecular ion peak, or M peak, in a mass spectrum indicates the relative abundance of the intact M+ ions. Assuming the molecular ion carries a +1 charge, the m/z value of this peak directly corresponds to the compound's molecular mass. Thus, the m/z value of the M peak reveals the compound's relative molecular mass (Mr).
For instance, in the mass spectrum below, pentane (C5H12) has an M peak at m/z 72. This shows that pentane's relative molecular mass is 72 g mol-1.
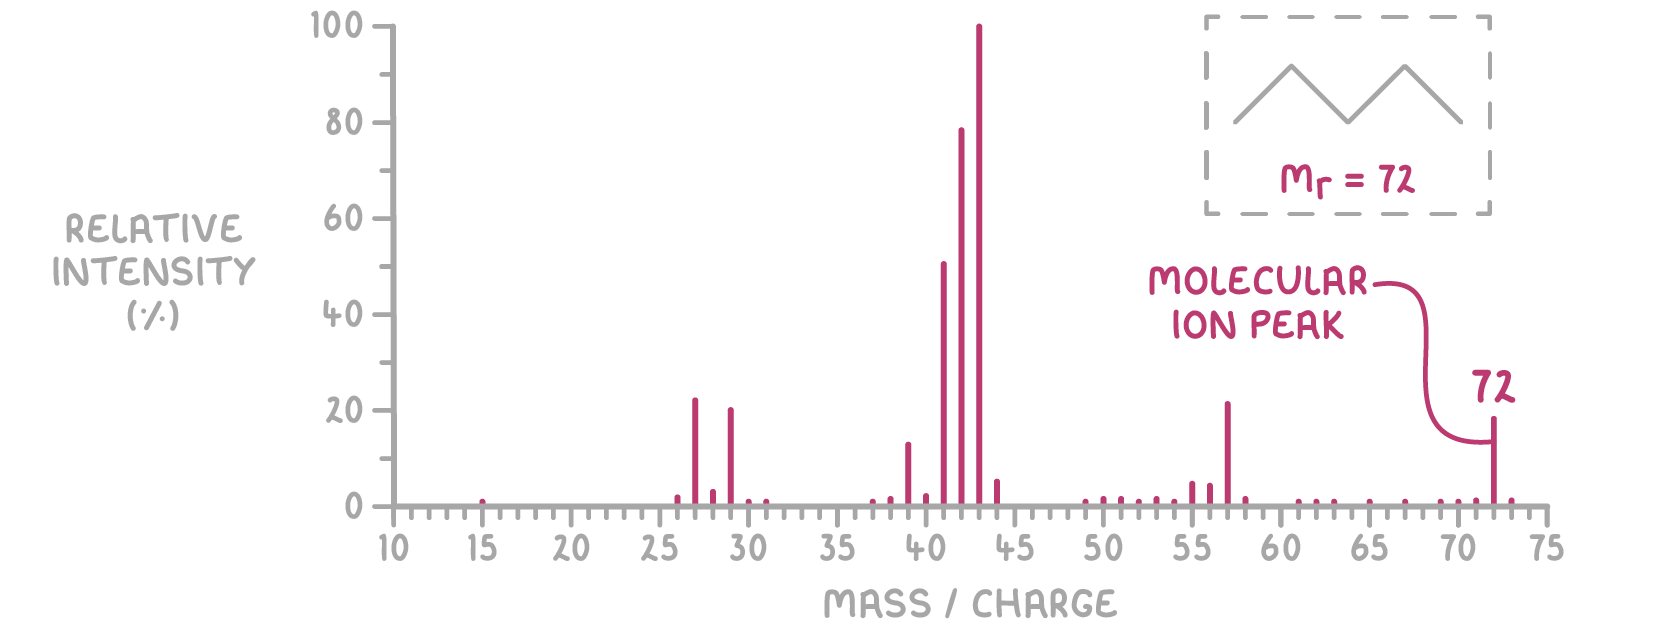
A smaller M+1 peak often represents molecular ions that include the carbon-13 isotope, providing additional insights into the sample's isotopic composition.
Fragmentation produces pattern related to structure
When molecular ions break apart, they form fragment ions that appear as distinct peaks on the mass spectrum.
These fragments can include:
- CH3+ (m/z = 15)
- C2H5+ (m/z = 29)
- C3H7+ (m/z = 43)
- OH+ (m/z = 17)
The pattern of fragmentation offers clues about the molecule's structure, as the m/z values of these peaks can be matched to known fragments to deduce the structural formula.
For example, the mass spectrum of pentane shows:
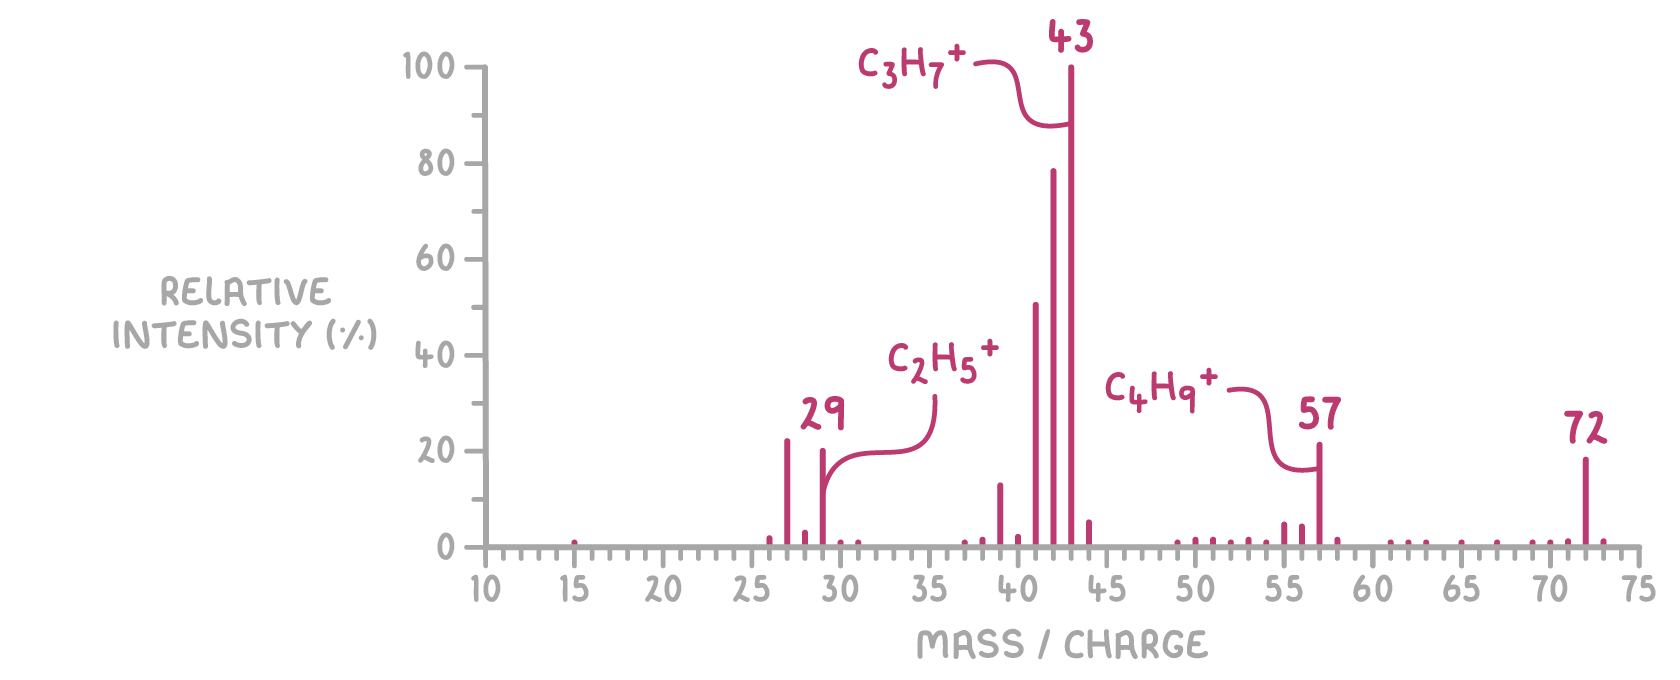
- A peak at m/z 29 suggests the presence of a CH3CH2+ fragment, indicating an ethyl group within the molecule.
- A peak at m/z 43 suggests a CH3(CH2)2+ fragment, indicating a propyl group.
- A peak at m/z 57 suggests a CH3(CH2)3+ fragment, indicating a butyl group.
Mass spectra differentiate between compounds
Compounds with identical molecular formulas can have unique fragmentation patterns in their mass spectra. This uniqueness enables mass spectrometry to distinguish between closely related molecules, such as propanal and propane, despite them having the same formula, C3H8O.
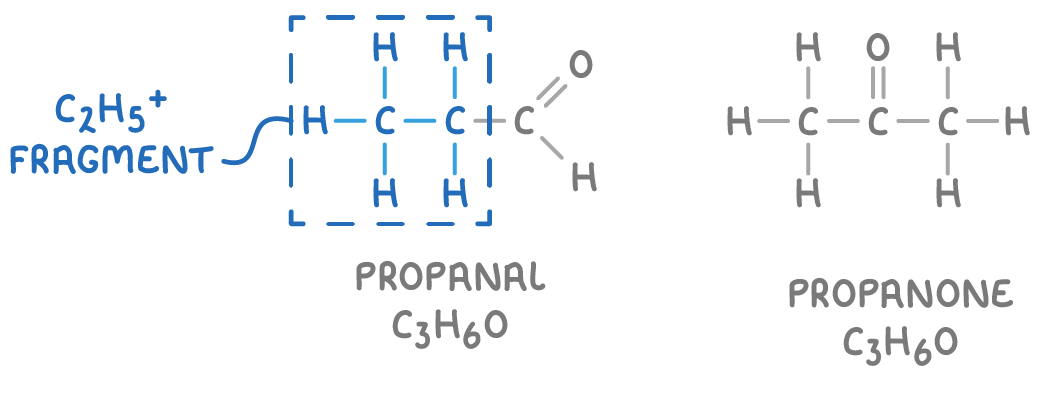
Propanal, for instance, can fragment to produce a C2H5+ ion, a fragmentation that is not possible for propane.
Computer databases can rapidly match an unknown compound's distinctive spectrum to identify its structure.
High resolution mass spectrometry
Some mass spectrometers, called high resolution mass spectrometers, can measure atomic and molecular masses with extreme precision (to several decimal places). This enables differentiation between compounds with similar molecular masses.
Some accurate isotopic masses of the most common atoms found in organic molecules are:
| Isotope | Relative isotopic mass |
|---|---|
| 1H | 1.0078 |
| 12C | 12.0000 |
| 14N | 14.0031 |
| 16O | 15.9949 |
For instance, propane (C3H8) and ethanal (C2H4O) both have a relative molecular mass of 44 when rounded to the nearest whole number.
However, high resolution mass spectrometry shows:
- Propane has a molecular ion peak at m/z = 44.0624
- Ethanal has a molecular ion peak at m/z = 44.0261
The precise m/z values allow unambiguous identification.