Measuring Rates of Reaction From a Graph
This lesson covers:
- How to calculate the mean rate of reaction from a graph
- How to calculate the rate of reaction at a specific time from a graph
Mg + 2HCl ➔ MgCl2 + H2
1.5 g of magnesium takes 4 minutes to react completely. Calculate the mean rate of reaction. Give your answer in g/min.
g/min
|
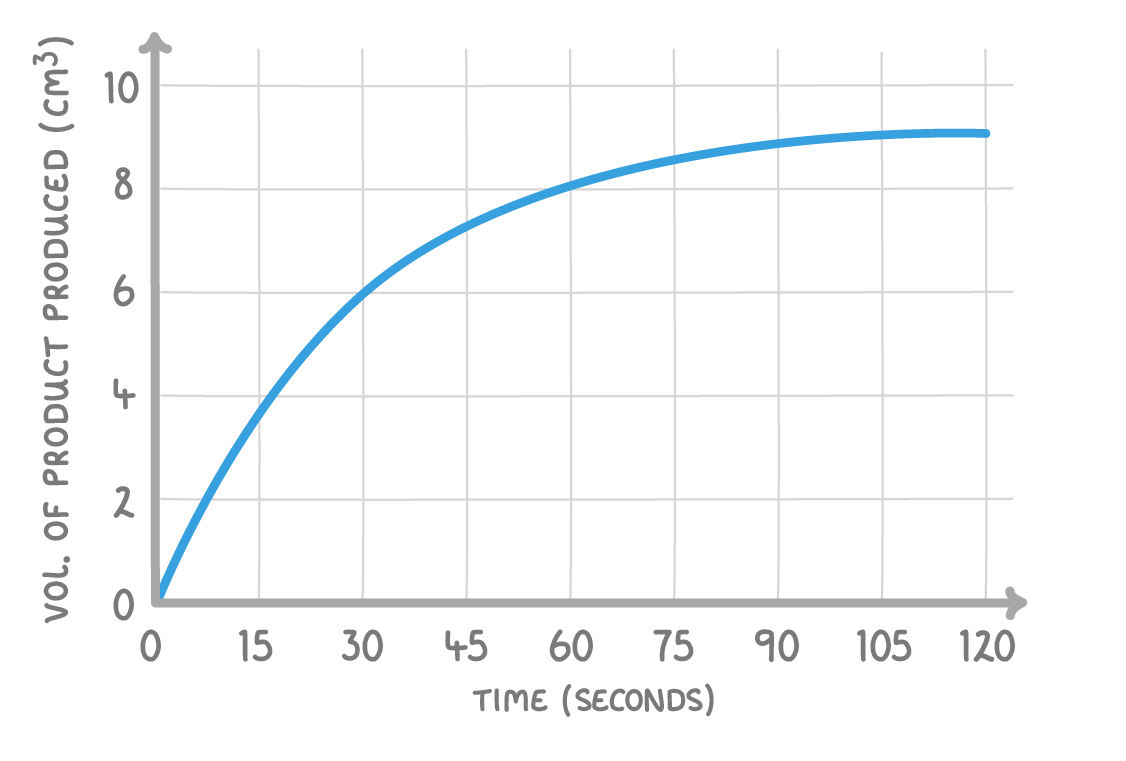
Using the above graph, what is the mean rate of reaction in the first 30 seconds?
Give your answer in cm3/s
cm3/s
|
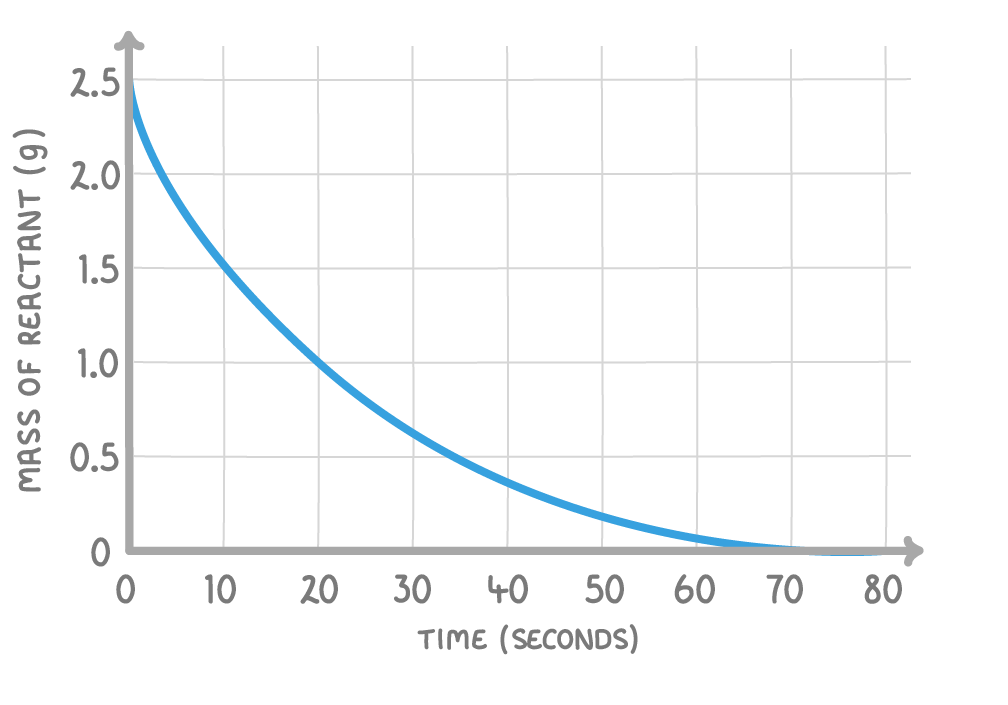
Using the above graph, what is the mean rate of reaction in the first 20 seconds?
Give your answer in g/s.
g/s
|
Which of the following is the equation to calculate the gradient?
|
By finding the gradient of the tangent to a curve at a specific time, we can calculate the:
Rate of reaction at a specific time
Mean rate of reaction
|
During a chemical reaction, when is the rate normally fastest?
At the start
In the middle
At the end
|
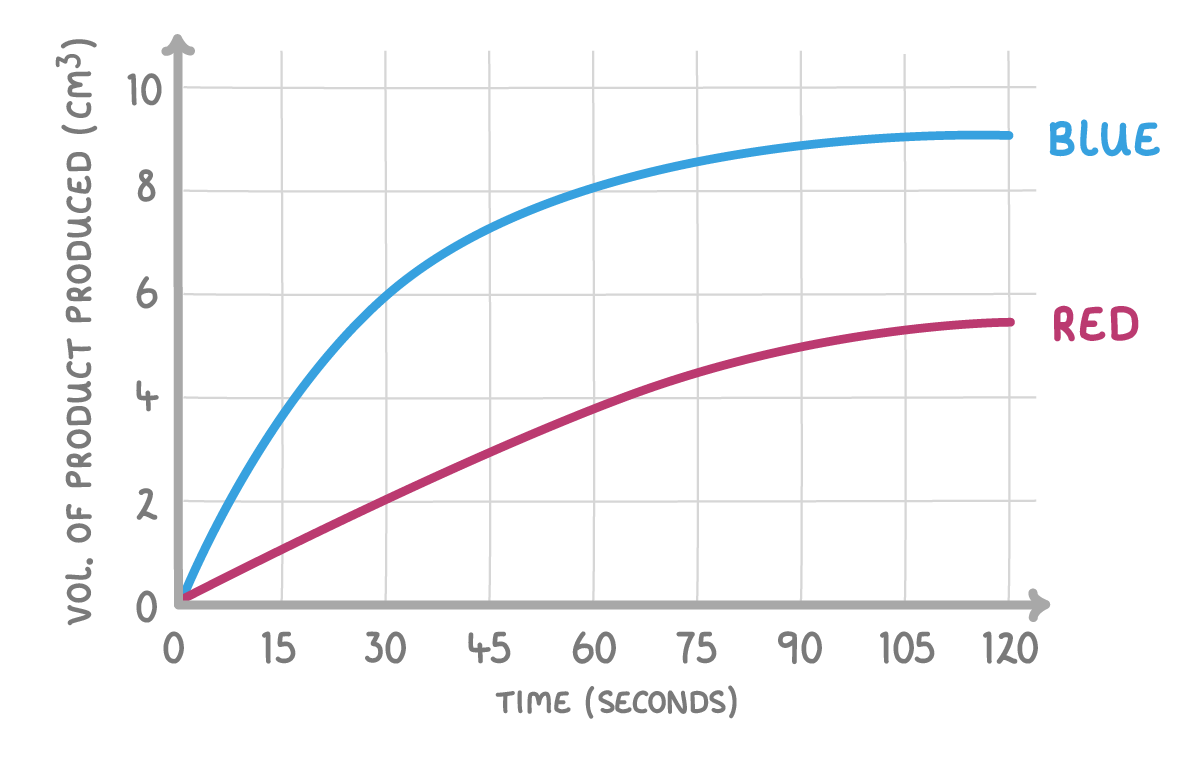
In the above graph, which of the following lines indicates a faster reaction?
Blue
Red
|
The line is steepest at the start of a reaction because there are a lot of reactants.
Over time, the line becomes steep as the reactants are used up.
At the end of the reaction, when all the reactants have been used up, the line p.
|