Rates of Reaction
This lesson covers:
- How to measure & calculate the rate of a reaction
- How to interpret the rate of a reaction from a graph

Iron can react with oxygen to form iron oxide. This is also known as rusting.
Is this a fast or slow chemical reaction?
Fast
Slow
|
When you strike a match it causes a tiny amount of red phosphorus to be converted to white phosphorus, which then ignites spontaneously in air.
Is this a fast or slow chemical reaction?
Fast
Slow
|
To measure the rate of a reaction, we can either measure how fast the are being used up, or how fast the are being formed.
|
Which of the following are the equation(s) to calculate the overall rate of a reaction?
(Select all that apply)
|
Which of the following could be units for the rate of a reaction?
(Select all that apply)
m/s
mol/s2
cm3/s
g/min
|
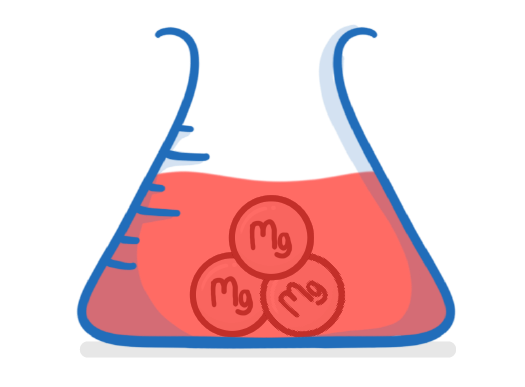
0.4 g of magnesium reacts completely with dilute hydrochloric acid in 1 min 20 s. What is the overall rate of the reaction? Give your answer in g/s.
g/s
|
Mg + 2HCl ➔ MgCl2 + H2
90cm3 of hydrogen gas was produced after 5 mins. What is the overall rate of reaction? Give your answer in cm3/s.
cm3/s
|
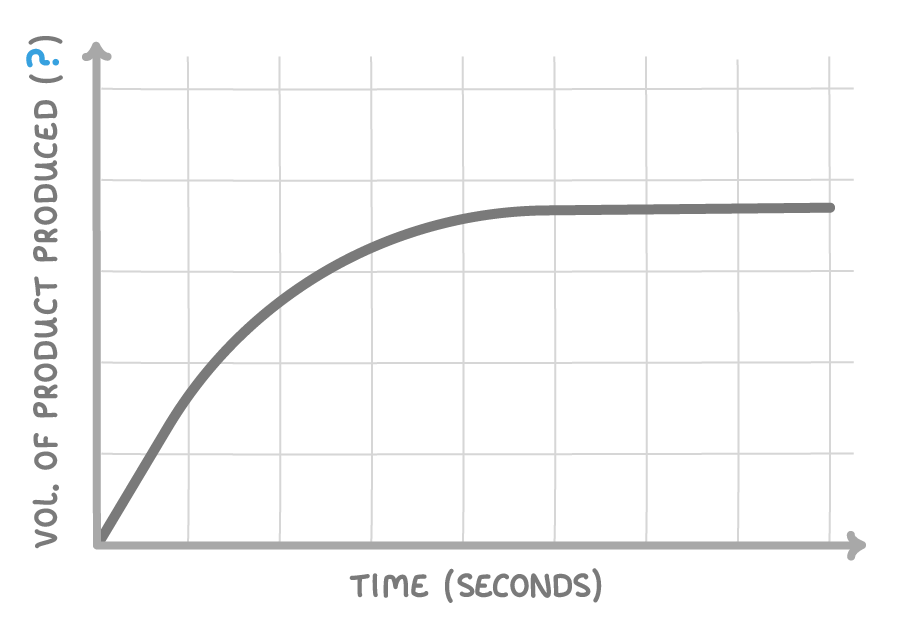
What would the units of the y-axis be?
s
g
mol
cm3
|
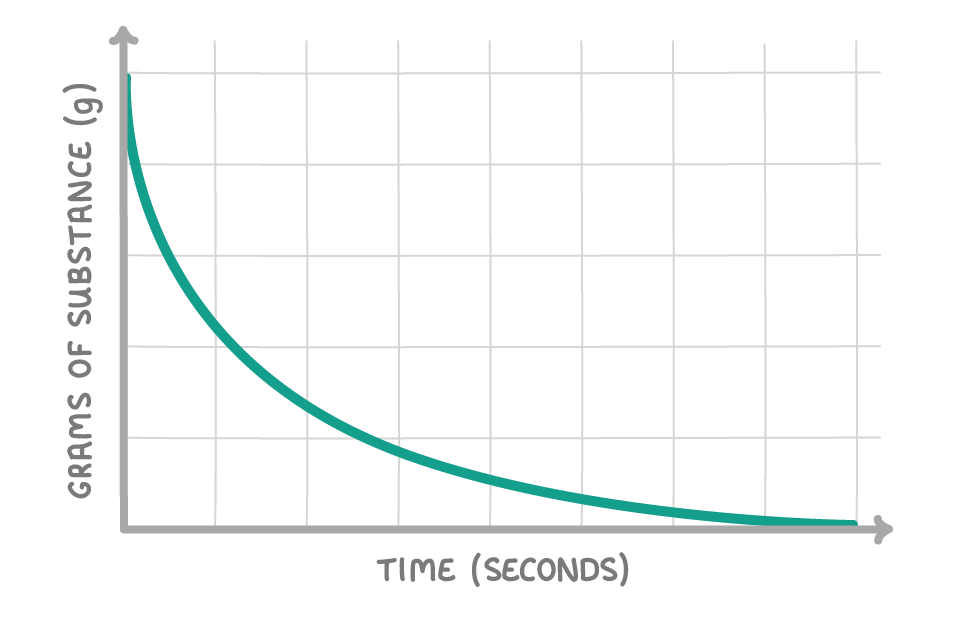
The above graph shows how the quantity of a substance changes over the course of a reaction. Is the substance a reactant or a product?
Reactant
Product
|
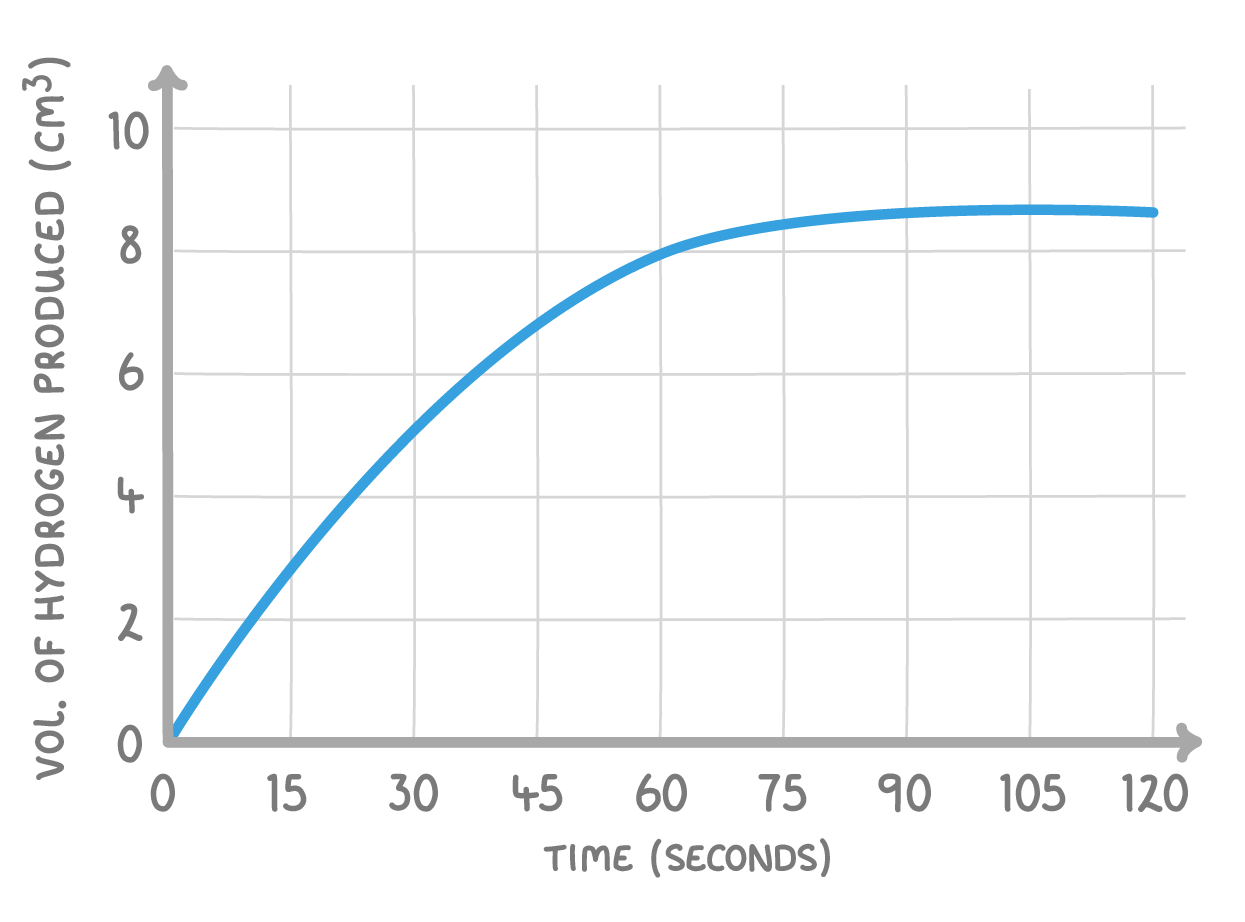
Sodium reacts with hydrochloric acid to form sodium chloride and hydrogen gas:
2Na + 2HCl ➔ 2NaCl + H2
The graph above shows how the quantity of hydrogen produced changed over time. Describe and explain the shape of the graph.
|