Exothermic & Endothermic Reactions
This lesson covers:
- What exothermic and endothermic mean
- How to represent exothermic and endothermic reactions using reaction profiles (also known as energy level diagrams)
- What activation energy is, and how to show it on a reaction profile
True or false? Energy is stored in chemical bonds.
True
False
|
True or false? Different chemical bonds hold different amounts of energy.
True
False
|
If the reactant molecules in a reaction have more energy in their chemical bonds than the product molecules, will energy be absorbed or released overall?
Absorbed
Released
|
What is an exothermic reaction?
A reaction that releases thermal energy to the surroundings
A reaction that takes in thermal energy from the surroundings
|
If an exothermic reaction occurs in a closed container, what would happen to the temperature inside the container?
The temperature would increase
The temperature would decrease
|
What is an endothermic reaction?
A reaction that releases thermal energy to the surroundings
A reaction that takes in thermal energy from the surroundings
|
If an endothermic reaction occurs in a closed container, what would happen to the temperature inside the container?
The temperature would decrease
The temperature would increase
|

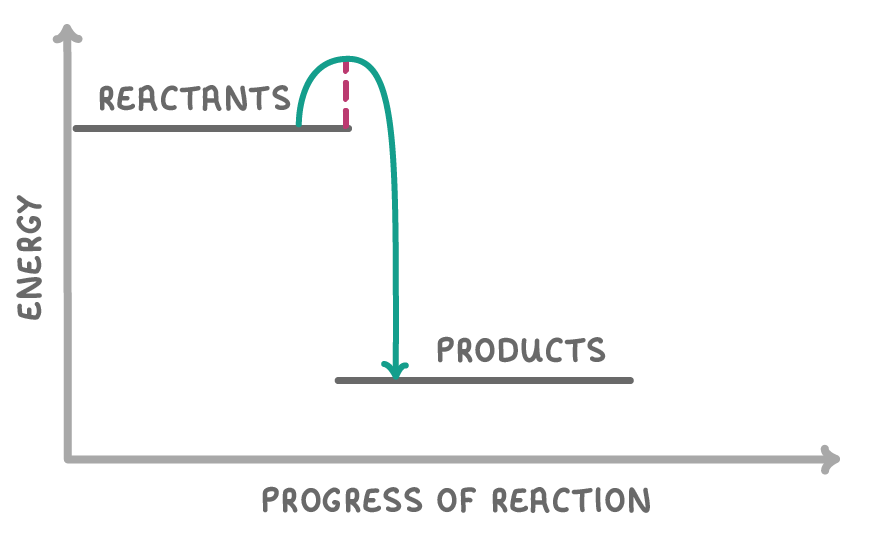
What type of reaction is shown in the reaction profile above?
An exothermic reaction
An endothermic reaction
|
What type of reaction is the reaction profile above?
An exothermic reaction
An endothermic reaction
|
react / energy / minimum / maximum
Activation energy is the amount of the reactant particles require in order to collide with each other and .
|
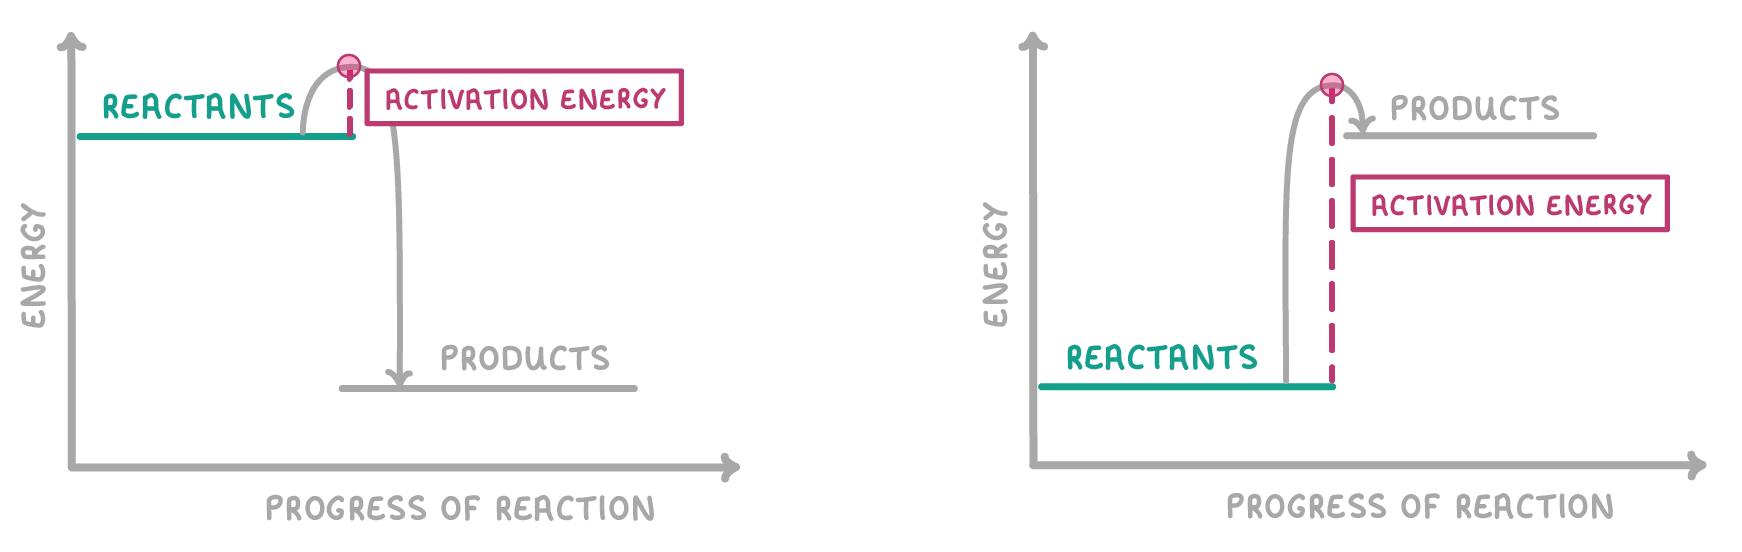
On reaction profile diagrams, the activation energy is always the increase in energy from the reactants to the peak of curve.
This applies to both the exothermic and endothermic diagrams.

Which of the above shows the activation energy?
A
B
C
|

Which of the above arrows indicates the energy change of the reaction?
A
B
C
|