Heating and cooling curves
This lesson covers:
- What are heating and cooling curves?
- The energy changes that occur during heating and cooling.
What are heating and cooling curves?
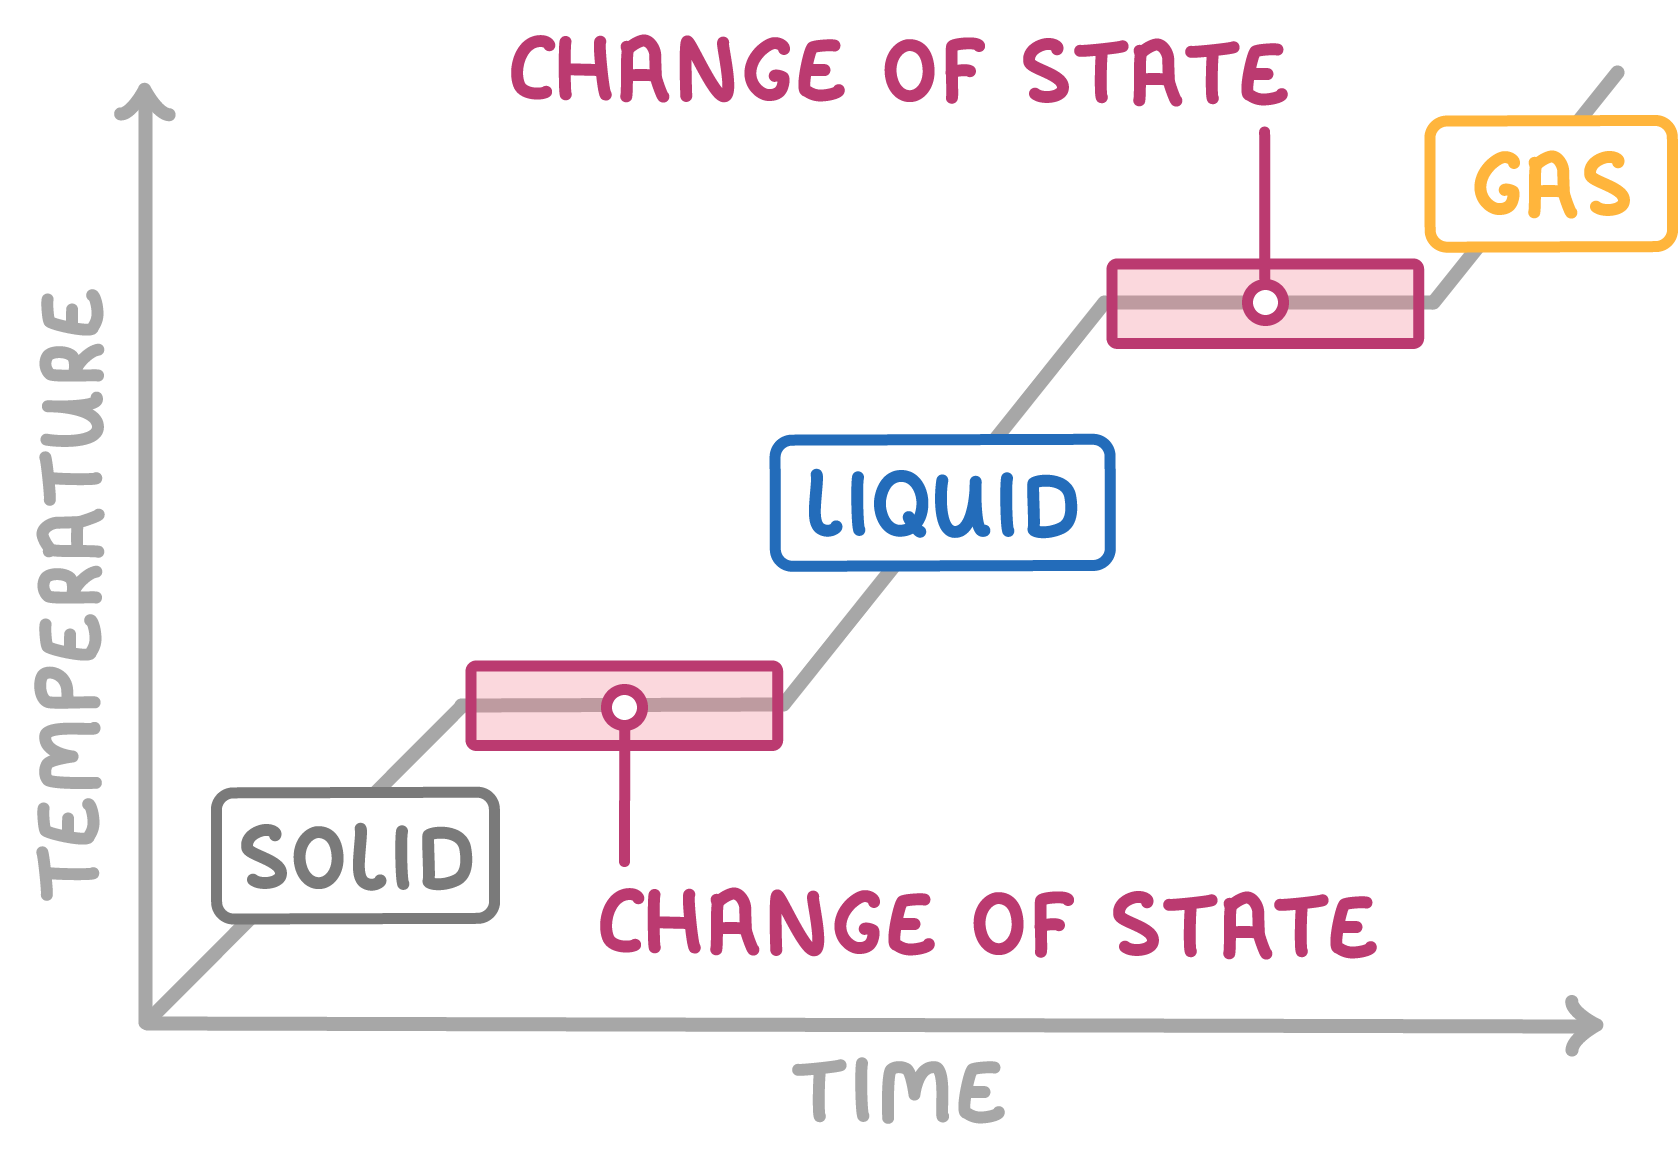
Heating and cooling curves show how temperature changes when a substance is heated up or cooled down.
The curves are flat when the substance changes state, like melting, boiling, freezing or condensing.
Heating curves
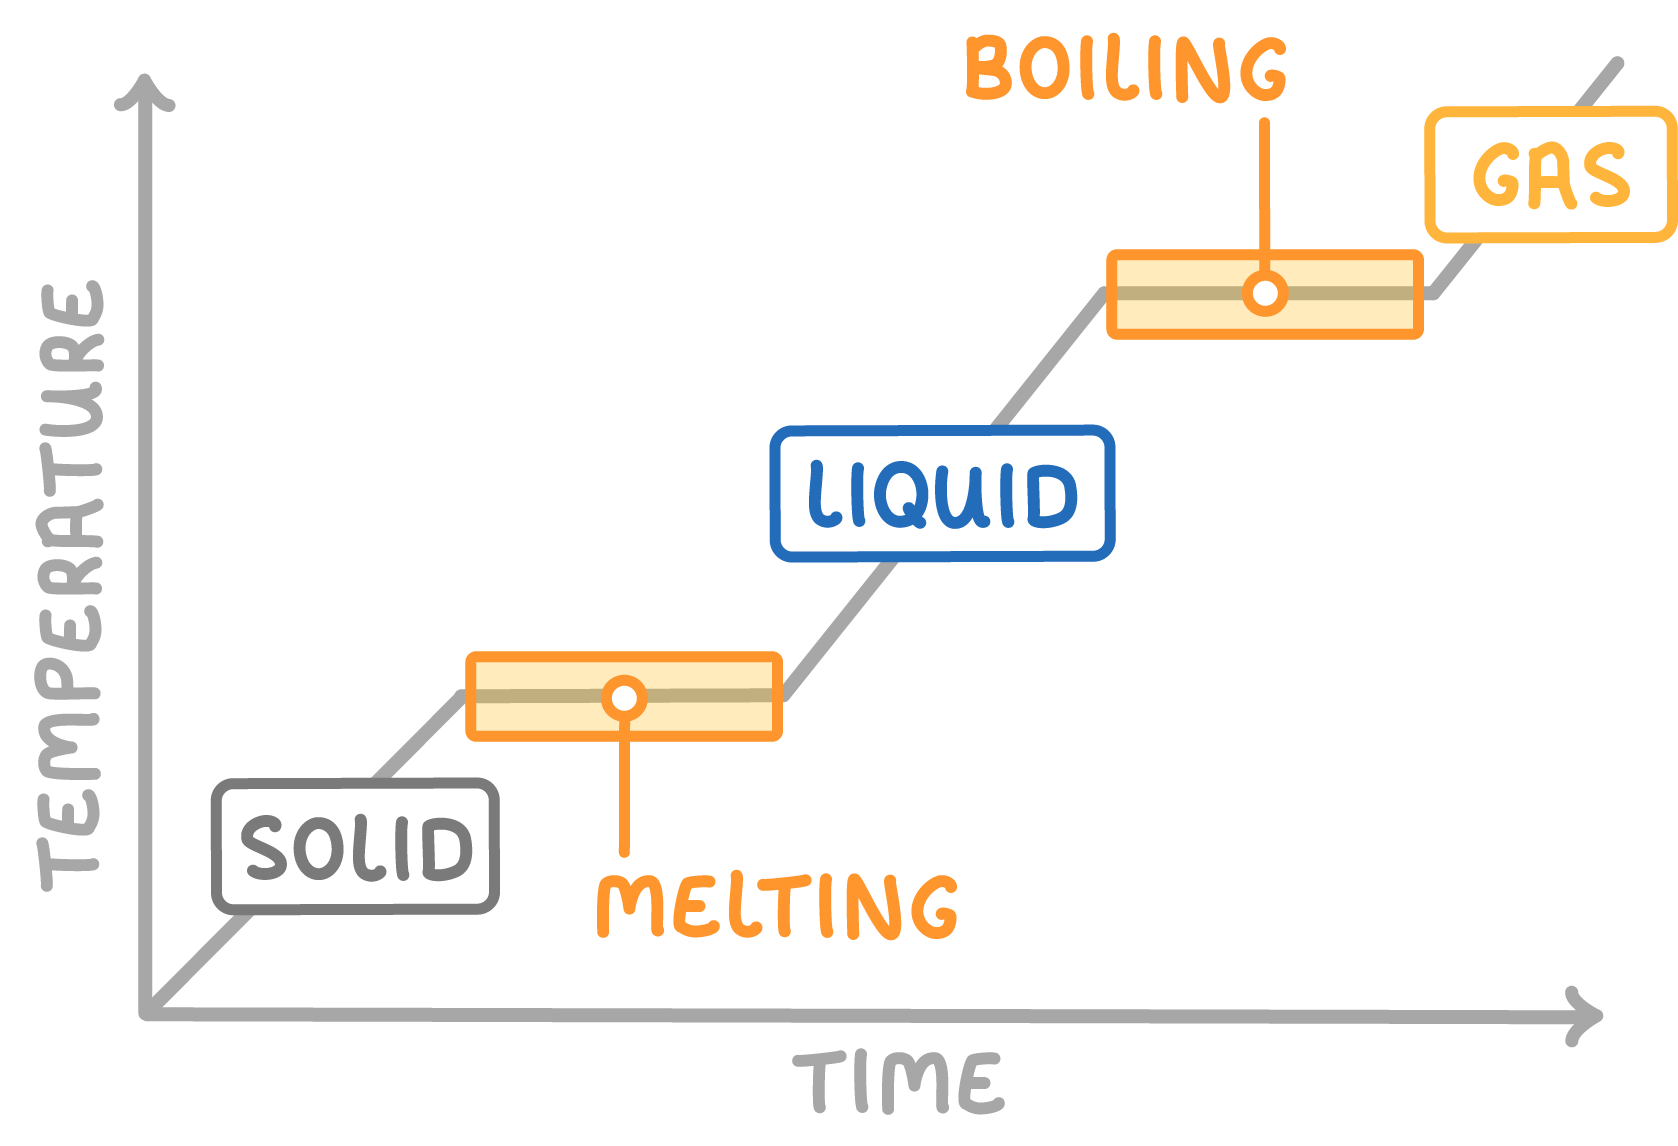
- When a solid is heated, the particles gain energy and vibrate more. The temperature rises as heat is added.
- At the melting point, energy goes into breaking bonds between particles, turning the solid to liquid.
- The temperature stays the same during melting, giving a flat line on the graph.
- The same happens when a liquid is heated to boiling point. Energy is used to break the bonds completely, forming a gas.
- The temperature stays steady during boiling, giving another flat line.
Cooling curves
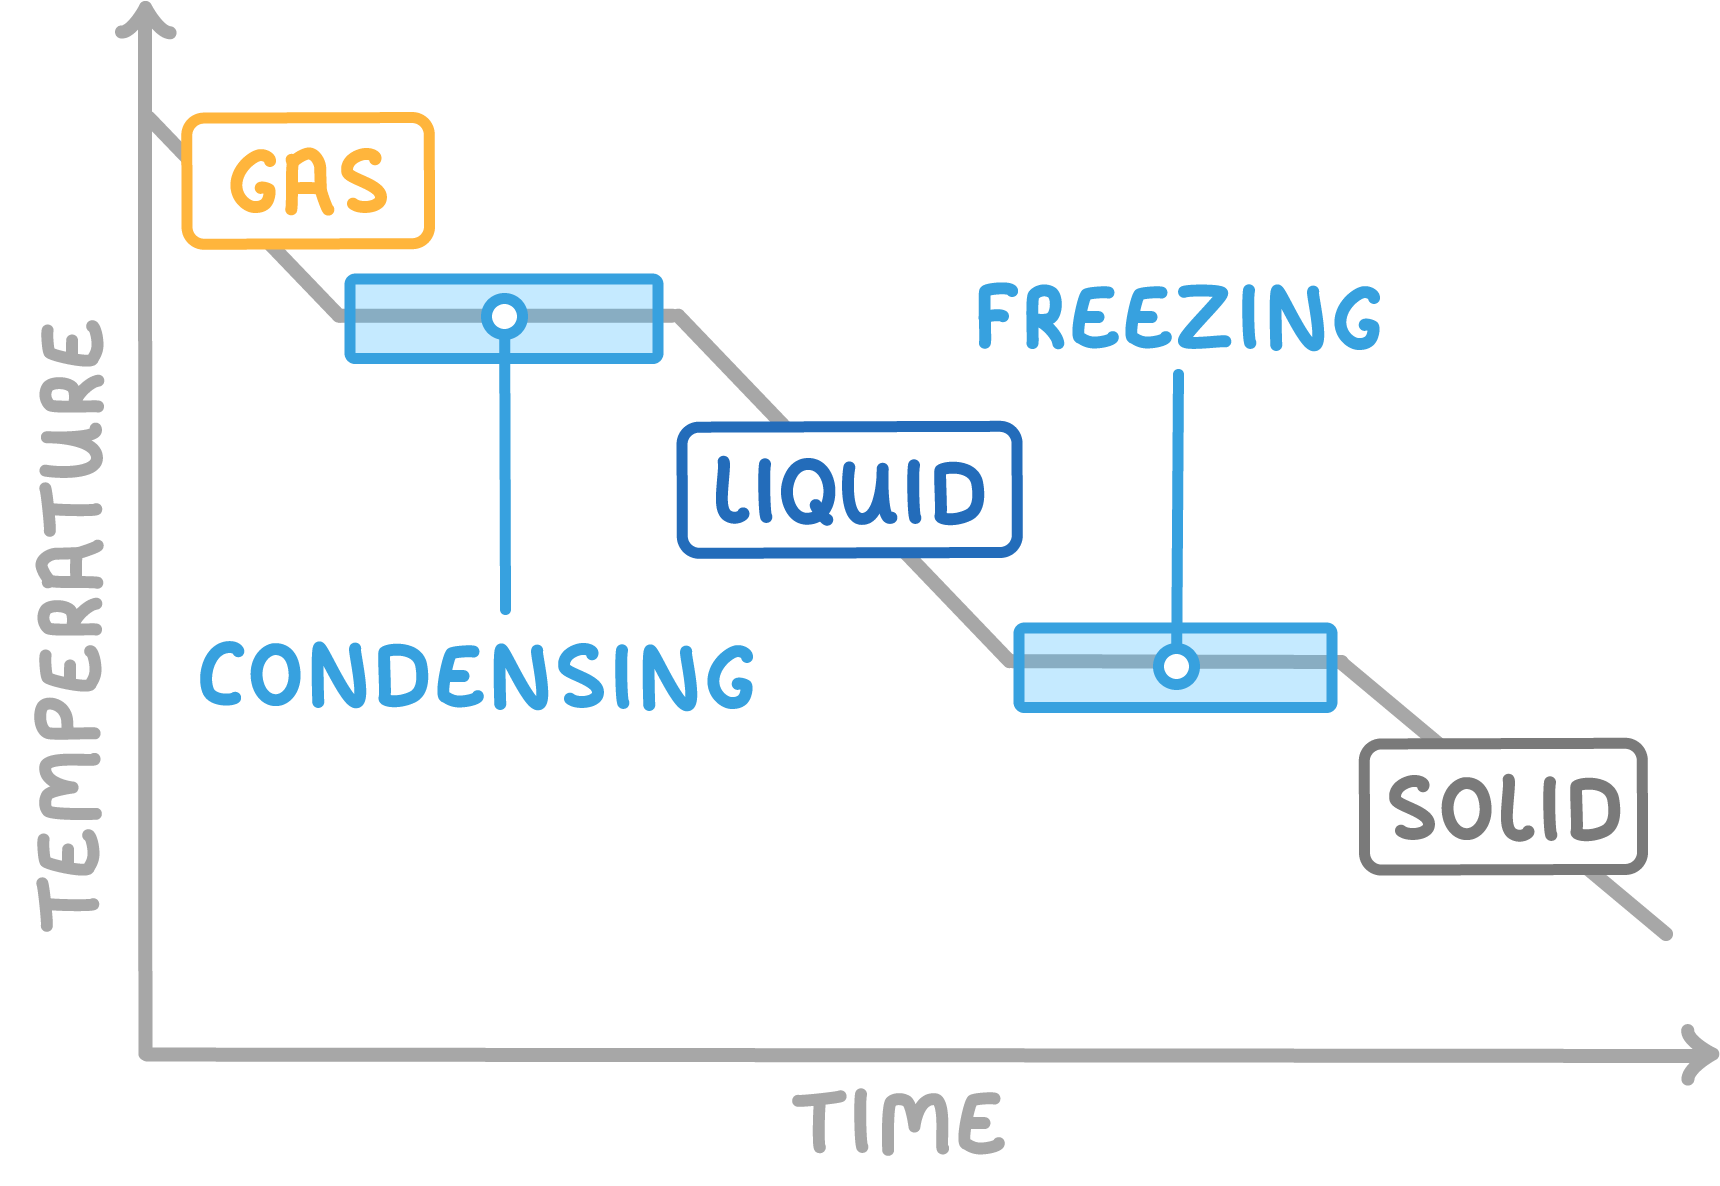
- When a gas is cooled, particles slow down and lose energy. The temperature drops as heat is given off.
- At the condensation point, particles come together and bond turning the gas into a liquid. The energy released stops the temperature dropping further.
- The temperature stays the same during condensation giving a flat line on the graph.
- The same happens a when liquid is cooled to freezing point. Particles arrange into solid structure, releasing heat energy.
- This stops temperature dropping as liquid becomes solid, giving another flat line.