Correlation Coefficients
This lesson covers:
- What correlation is
- Spearman's rank correlation for assessing relationships between two variables
- Pearson’s linear correlation for assessing relationships between two variables
What is correlation?
Correlation refers to the relationship between two variables.
The correlation can be:
- Positive - This is when both variables increase or decrease together, where a value near +1 indicates a strong positive correlation.
- Negative - This is when one variable increases as the other decreases, where a value near -1 suggests a strong negative correlation.
- Non-existent - This is when there is no correlation, indicated by a correlation coefficient close to 0.
A correlation coefficient of 1 indicates a perfect, positive linear correlation, where all points lie on a straight line.
There are two statistical tests you need to know that can determine correlation:
- Spearman's rank correlation - Determines if there is a correlation between two variables when one or both of them are not normally distributed.
- Pearson's linear correlation - Determines if there is a linear correlation between two variables that are normally distributed.
Spearman's rank correlation for assessing relationships between two variables
Spearman’s rank correlation coefficient is used to measure the strength and direction of association between two continuous variables that are not normally distributed.
The process for calculating Spearman's rank correlation is:
- Convert the raw data values of each variable into ranks from the smallest value to the largest value.
- If two values are the same for one variable, give them an average rank (e.g. if the two smallest values are 6 mm, they would both have the rank 1.5, and the next smallest value would have the rank 3).
- Determine the difference in ranks (d) for each pair of values.
- Square these rank differences (d2).
- Sum up all the squared rank differences.
- Calculate Spearman's rho (ρ).
Use the formula (this will be provided in an exam):
ρ=1−n3−n6∑d2
Where:
- ρ= Spearman’s rank correlation coefficient
- ∑d2= sum of the squared differences of the ranks
- n= number of pairs of data
You will most likely be given critical value tables that use the sample size, n, for this test, rather than needing to calculate degrees of freedom.
Then, compare ρ to a critical value at 5% significance level to determine the significance of the correlation:
- A ρ value near +1 indicates a strong positive correlation.
- A ρ value near -1 suggests a strong negative correlation.
- A ρ value around 0 implies there is no correlation.
It can be helpful to carry out the calculations for steps 1 to 4 in a table, for example:
| Sample | Stem length (mm) | Leaf width (mm) | Rank: stem length | Rank: leaf width | Rank difference (d) | d2 |
|---|---|---|---|---|---|---|
| 1 | 79 | 54 | 10 | 6.5 | 3.5 | 12.25 |
| 2 | 73 | 80 | 9 | 9 | 0 | 0 |
| 3 | 20 | 31 | 1 | 1 | 0 | 0 |
| 4 | 23 | 66 | 2.5 | 8 | -5.5 | 30.25 |
| 5 | 67 | 54 | 8 | 6.5 | 1.5 | 2.25 |
| 6 | 64 | 42 | 7 | 3 | 4 | 16 |
| 7 | 39 | 51 | 5 | 4 | 1 | 1 |
| 8 | 29 | 53 | 4 | 5 | -1 | 1 |
| 9 | 59 | 36 | 6 | 2 | 4 | 16 |
| 10 | 23 | 88 | 2.5 | 10 | -7.5 | 56.25 |
Worked example - Correlation of study time and test scores using Spearman's rank
The table below shows the study time and test scores of 10 students. The critical value at the 5% level for n = 10 is 0.600.
| Sample | Study time (hours) | Test score (%) |
|---|---|---|
| 1 | 5.5 | 78 |
| 2 | 3.2 | 65 |
| 3 | 8.1 | 82 |
| 4 | 2.4 | 59 |
| 5 | 6.7 | 80 |
| 6 | 7.3 | 88 |
| 7 | 1.8 | 55 |
| 8 | 4.6 | 73 |
| 9 | 9.0 | 94 |
| 10 | 10.5 | 90 |
Using Spearman's rank correlation coefficient, assess whether there is a significant correlation between study time and test scores.
Step 1: Equation
ρ=1−n(n2−1)6∑d2
Step 2: Rank the data to calculate d2
rank the data for both variables from smallest to largest, using the average rank when two values are identical, and then calculate the rank difference (d) and d2
| Sample | Study time (hours) | Test score (%) | Rank: study time | Rank: test score | Rank difference (d) | d2 |
|---|---|---|---|---|---|---|
| 1 | 5.5 | 78 | 5 | 5 | 0 | 0 |
| 2 | 3.2 | 65 | 3 | 3 | 0 | 0 |
| 3 | 8.1 | 82 | 8 | 7 | 1 | 1 |
| 4 | 2.4 | 59 | 2 | 2 | 0 | 0 |
| 5 | 6.7 | 80 | 6 | 6 | 0 | 0 |
| 6 | 7.3 | 88 | 7 | 8 | -1 | 1 |
| 7 | 1.8 | 55 | 1 | 1 | 0 | 0 |
| 8 | 4.6 | 73 | 4 | 4 | 0 | 0 |
| 9 | 9.0 | 94 | 9 | 10 | -1 | 1 |
| 10 | 10.5 | 90 | 10 | 9 | 1 | 1 |
Step 3: Substitution and correct evaluation
ρ=1−n(n2−1)6∑d2
sum of the squared differences of ranks (∑d2)=4
n=10
ρ=1−10(102−1)6×4
ρ=1−99024
ρ=1−0.0242
ρ=0.976
Step 4: Determine significance and interpret result
the significance of the correlation coefficient is determined by comparing it to a critical value at a chosen significance level
the critical value at the 5% level for n = 10 is 0.648, so the correlation coefficient of 0.976 is much larger than the critical value
this means the correlation is significant at the 5% level, indicating a very strong positive correlation between study time and test scores that is unlikely to be due to chance
Pearson’s linear correlation for assessing relationships between two variables
Pearson's correlation coefficient (r) measures the strength and direction of the linear relationship between two continuous variables that are normally distributed.
The process for calculating Pearson’s linear correlation is:
- Calculate the mean of all the x values (xˉ).
- Calculate the mean of all the y values (yˉ).
- Calculate the standard deviation for x (sx) and y (sy):
sx=√n−1Σ(x−xˉ)2
sy=√n−1Σ(y−yˉ)2
- For each pair of data points, multiply the x and y values to calculate xy.
- Sum all the xy products to find the total (∑xy).
- Substitute the calculated values into a formula.
The formula to use is as follows (this will be provided in an exam):
r=(n−1)sxsy∑xy−nxˉyˉ
Where:
- r = correlation coefficient, representing the strength and direction of the linear relationship.
- x, y = the variables being compared.
- xˉ, yˉ = means of the variables.
- sx, sy = standard deviations of the variables.
- n = number of pairs of data.
- Calculate the degrees of freedom, which in Pearson’s linear correlation are n - 2.
- Compare r to a critical value at 5% significance level to determine the significance of the correlation.
Worked example - Calculating Pearson's correlation coefficient
Is there a correlation between the number of daisies and dandelions recorded in ten quadrats?
| Quadrat | Number of daisies (x) | Number of dandelions (y) |
|---|---|---|
| 1 | 15 | 30 |
| 2 | 12 | 25 |
| 3 | 18 | 35 |
| 4 | 10 | 20 |
| 5 | 20 | 40 |
| 6 | 11 | 22 |
| 7 | 17 | 34 |
| 8 | 14 | 28 |
| 9 | 19 | 38 |
| 10 | 13 | 26 |
Step 1: Equation
r=(n−1)sxsy∑xy−nxˉyˉ
Step 2: Calculation of the means
xˉ=n∑x=10149=14.9
yˉ=n∑y=10298=29.8
Step 3: Construct table to calculate differences, squares, and product of x and y
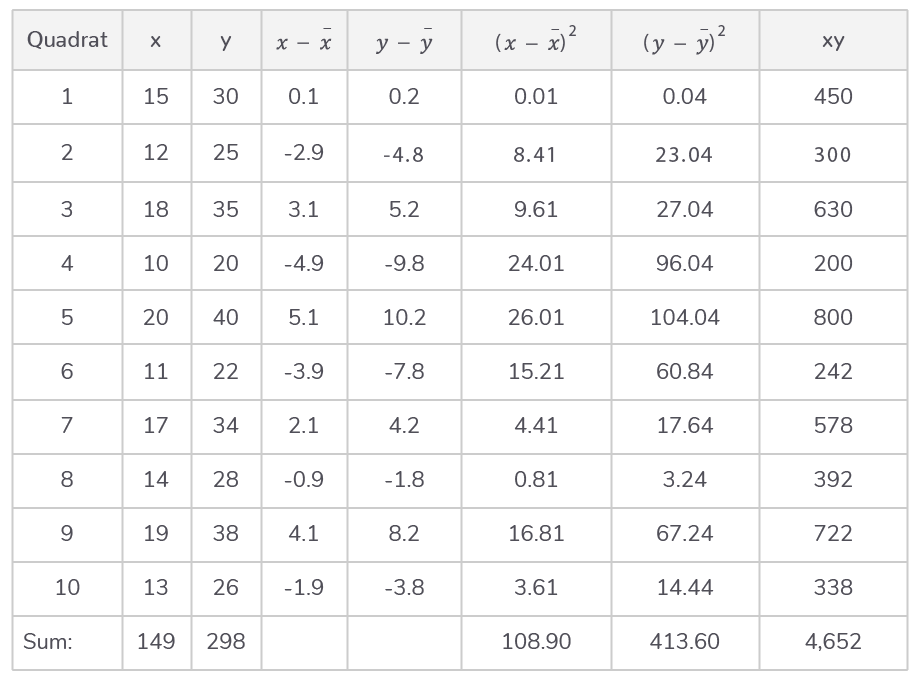
Step 4: Calculation of the standard deviations
sx=√n−1∑(x−xˉ)2=√9108.9≈3.479
sy=√n−1∑(y−yˉ)2=√9413.6≈6.779
Step 5: Substitution and correct evaluation
r=(n−1)sxsy∑xy−nxˉyˉ
r=(10−1)×3.479×6.7794652−(10×14.9×29.8)
r=9×3.479×6.7794652−4440.2
r=212.257211.8
r≈0.998 (to 3 s.f.)
Step 6: Determine significance and interpret result
the degrees of freedom (df) for Pearson's r are n−2, which in this case is 10−2=8
the critical value for r with 8 degrees of freedom at a 5% significance level is approximately 0.632, according to the Pearson's r critical values table
as the r value of 0.998 is greater than 0.632, the result is statistically significant. There does seem to be a positive correlation between the number of daisies and dandelions in the quadrats