Pearson's Correlation Coefficient
This lesson covers:
- What correlation is
- Calculating and interpreting Pearson's correlation coefficient
What is correlation?
Correlation refers to the relationship between two variables.
The correlation can be:
- Positive - This is when both variables increase or decrease together.
- Negative - This is when one variable increases as the other decreases.
- Non-existent - This is when there is no clear relationship, indicated by a correlation coefficient close to 0.
A correlation coefficient of 1 indicates a perfect, positive linear correlation, where all points lie on a straight line.
Calculating Pearson's correlation coefficient
Pearson's correlation coefficient (r) assesses the strength and direction of a linear relationship between two continuous variables that are normally distributed, x and y.
The formula is (this will be provided in an exam):
r=√∑(x−xˉ)2√∑(y−yˉ)2∑(x−xˉ)(y−yˉ)
Where:
- ∑ represents the sum of.
- xˉ is the mean (average) of all x values.
- yˉ is the mean (average) of all y values.
The process for calculating Pearson's correlation is:
- Calculate the mean of each variable.
- Subtract the mean from each observed value (x−xˉ and y−yˉ).
- Square the values calculated in step 2 ((x−xˉ)2 and (y−yˉ)2).
- Multiply together the values calculated in step 2 ((x−xˉ)(y−yˉ)).
- Sum the values calculated in steps 3 and 4.
It may be helpful to carry out steps 2 to 5 in a table like shown below:
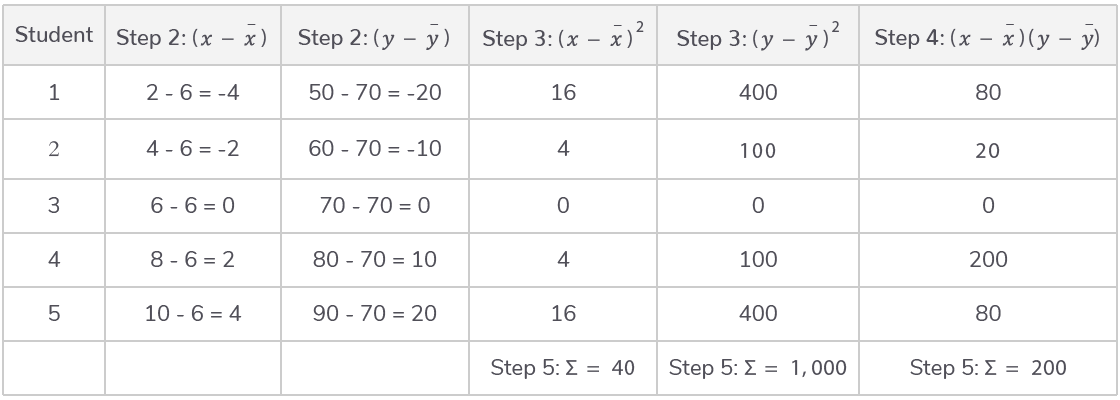
Then, substitute these values into the equation to find the Pearson’s correlation coefficient (r).
Finally, compare the calculated r value to a critical value at a 5% significance level. For this test, the degrees of freedom = n−2.
This determines the significance of the correlation:
- An r value near +1 indicates a strong positive correlation.
- An r value near -1 suggests a strong negative correlation.
- An r value around 0 implies there is no correlation.
Worked example - Calculating Pearson's correlation coefficient
Is there a correlation between height and weight based on the following data for 5 individuals?
| Individual | Height (cm) | Weight (kg) |
|---|---|---|
| 1 | 175 | 65 |
| 2 | 168 | 60 |
| 3 | 180 | 80 |
| 4 | 165 | 55 |
| 5 | 170 | 68 |
Step 1: Equation
r=√∑(x−xˉ)2√∑(y−yˉ)2∑(x−xˉ)(y−yˉ)
Step 2: Calculate the means xˉ and yˉ
xˉ=nSum of heights=5175+168+180+165+170=171.6 cm
yˉ=nSum of weights=565+60+80+55+68=65.6 kg
Step 3: Construct a table to calculate the differences from the mean and their products
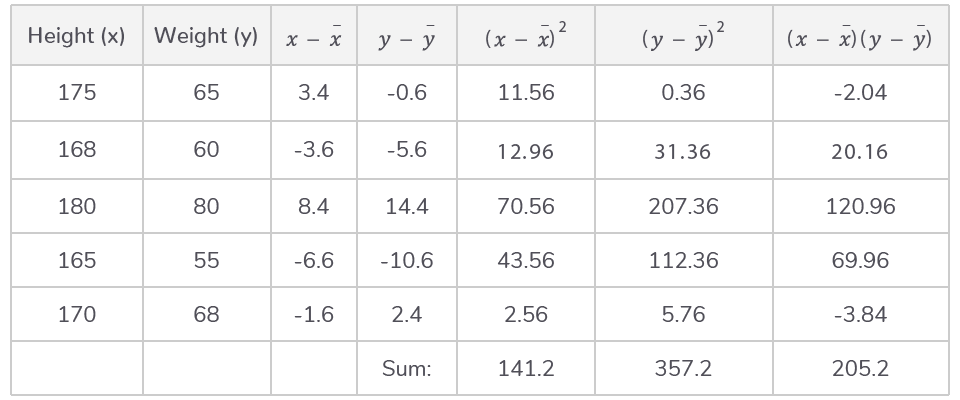
Step 4: Substitution and correct evaluation
r=√∑(x−xˉ)2√∑(y−yˉ)2∑(x−xˉ)(y−yˉ)
r=(√141.2)(√357.2)205.2
r=224.58205.2
r=0.914 (rounded to three decimal places)
Step 5: Determine significance and interpret result
for a sample size of 5, degrees of freedom = n−2=3, the critical value at the 5% significance level is 0.878
as the r value of 0.914 exceeds this critical value, the correlation between height and weight is statistically significant, and is unlikely to be due to chance
this indicates a strong positive correlation between height and weight among the individuals in this sample, suggesting that as height increases, weight also increases