Sampling Methods
This lesson covers:
- Taking random samples to study populations
- Using quadrats and transects for non-motile organisms
- Mark-release-recapture technique for motile species
- Investigating environmental factors influencing distribution
Random sampling to study populations
It's impractical to count all individuals across entire habitats.
Instead:
- Take random samples from target areas to avoid bias.
- Average the sample data to provide insight into whole populations.
- Take more samples to improve accuracy.
Sampling non-motile organisms
Quadrats and transects can effectively sample stationary and slow-moving species.
Quadrats
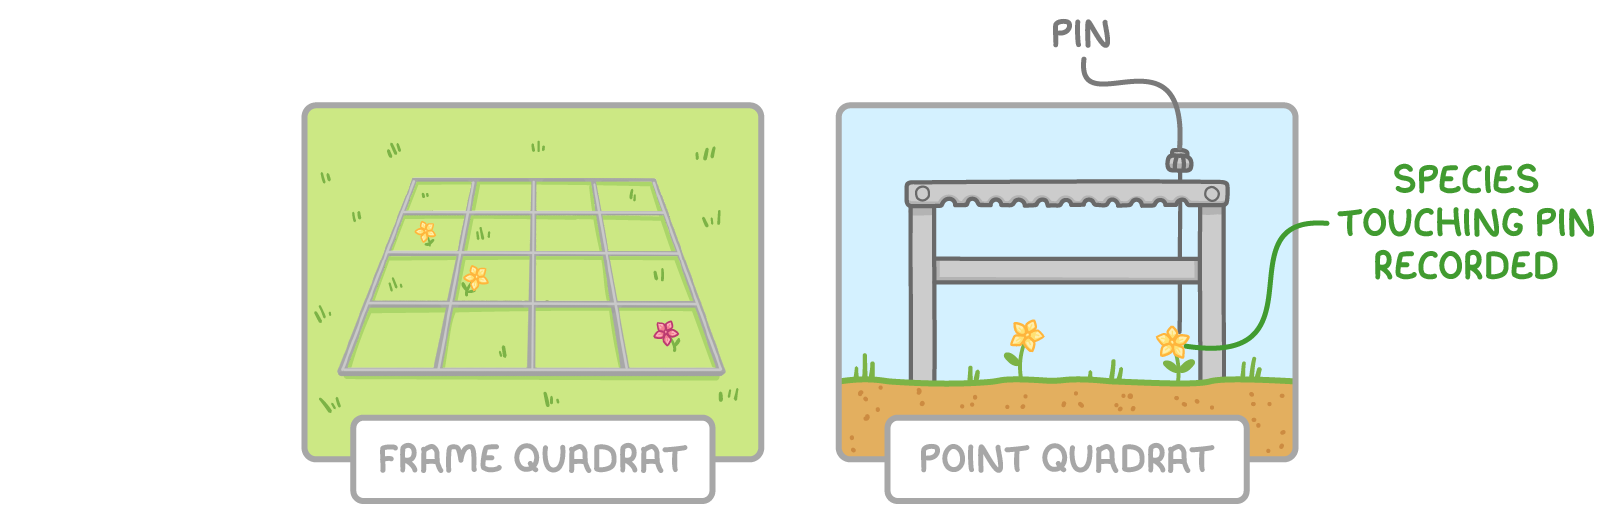
There are two types of quadrat that can be used to sample the organisms in an area:
- Point quadrat - This is a frame with a horizontal bar, and pins are pushed through at set intervals to touch the ground. Each species the pin touches is recorded.
- Frame quadrat - This is a square frame divided into a grid. The type and number of species within each section of the quadrat is recorded.
Methods of estimating the number of individuals in a frame quadrat:
- Frequency - Calculated as number of total squares in a quadratnumber of times a species is found in a quadrat×100.
- Percentage cover - An estimate of the area within a quadrat that a species covers.
Transects
Transects are straight lines made across an ecological area of study. They are used in systematic sampling.
Systematic sampling is a non-random sampling method where different areas within a habitat are sampled at regular intervals to avoid bias. It allows us to study of how species distributions change across different areas within a habitat.

There are two types of transect sampling you need to know:
- Continuous belt transects - These have quadrats placed continuously along the transect line to study populations and detect any changes across an environmental gradient.
- Interrupted belt transects - These have quadrats placed at regular intervals (e.g. every 5 m) along the line rather than continuously, which is faster but provides less precise data on population changes.
Both types of transect can reveal transitions and patterns in species distribution related to environmental factors.
The mark-release-recapture technique for motile species
The mark-release-recapture technique is commonly used to estimate the size of animal populations.
Steps in using the mark-release-recapture technique:
- Capture a sample of individuals from the target population in a defined area.
- Mark or tag each captured individual in some way (e.g. paint dots on them).
- Release the marked individuals back into the original habitat.
- Allow time for marked individuals to mix evenly throughout the population.
- Recapture another sample in the same area
- Record numbers of marked and unmarked individuals.
- Estimate total population size using the following formula:
estimated population size =number of recaptured marked individualstotal individuals in first sample × total individuals in second sample
Assumptions of the mark-release-recapture technique
There are some key assumptions that we make when we use the mark-release-recapture technique. If these assumptions are not met, the resulting population estimate may not be accurate.
Assumptions of the mark-release-recapture technique:
- The marked individuals distribute evenly among the rest of the population.
- The population remains constant with no significant immigration, emigration, births, or deaths.
- The population has a definite boundary.
- The marks are non-toxic and don't increase predation rates or change behaviour.
- The marks are permanent and cannot be lost.
Worked example - Estimating population size
In a habitat, 10 deer were originally captured, marked, and released. Later, 12 deer were captured including 2 marked ones.
What is the estimated total population size?
Step 1: Equation
estimated population size =number of recaptured marked individualstotal individuals in first sample × total individuals in second sample
Step 2: Substitution and correct evaluation
estimated population size =210×12
estimated population size =60 deer
Investigating the effect of abiotic factors on distribution
Species distribution often relates to environmental factors like pH, light intensity, soil water content, temperature, etc.
For example, there may be seashore vegetation gradients based on shell deposit acidity, where the pH is lower further inland due to rotting organic matter.
This could be investigated by:
- Placing the transect line perpendicular to the shore.
- Taking quadrat samples at regular intervals.
- Recording the percentage cover of the target species.
- Measuring the environmental variable (e.g. pH) at regular intervals.
- Producing a graph of the data and analysing the relationship.