Pyramids of Biomass
This lesson covers:
- Biomass is just the mass of living organisms
- How pyramids of biomass show the amount of biomass at each trophic level of a food chain
- Why the amount of biomass decreases as you go up the food chain
- How to calculate the efficiency of biomass transfer between levels in a food chain
What does each bar in a pyramid of biomass show?
The biomass of all organisms in that trophic level
The energy within all of organisms in that trophic level
The number of organisms in that trophic level
|

Roughly what proportion of energy biomass is transferred between trophic levels?
1%
10%
90%
100%
|
Which of these is NOT true when drawing pyramids of biomass?
The primary consumer is at the bottom
Bars must be equally spaced around the midpoint
Bars must be touching
|

Where are apex predators on a pyramid of biomass?
They are not shown on the pyramid
At the top of the pyramid
At the bottom of the pyramid
|
What does the biomass of an organism refer to?
The mass of waste an organism excretes in its life
The mass of food an organism ingests in its life
The mass of an organism
|

The image above shows a pyramid of biomass. Which trophic level does the highlighted bar represent?
Producers
Secondary consumers
Apex predators
Decomposers
Primary consumers
|

The image above shows a pyramid of biomass. Which trophic level does the highlighted bar represent?
Apex predators
Producers
Secondary consumers
Primary consumers
Decomposers
|

The image above shows a pyramid of biomass. Which trophic level does the highlighted bar represent?
Secondary consumers
Apex predators
Decomposers
Primary consumers
Producers
|
Which of the groups below is NOT shown on a pyramid of biomass?
Primary consumers
Producers
Decomposers
Apex predators
Secondary consumers
|
Give three reasons why only ~10% of the energy & biomass is passed on at each stage in a food chain?
|
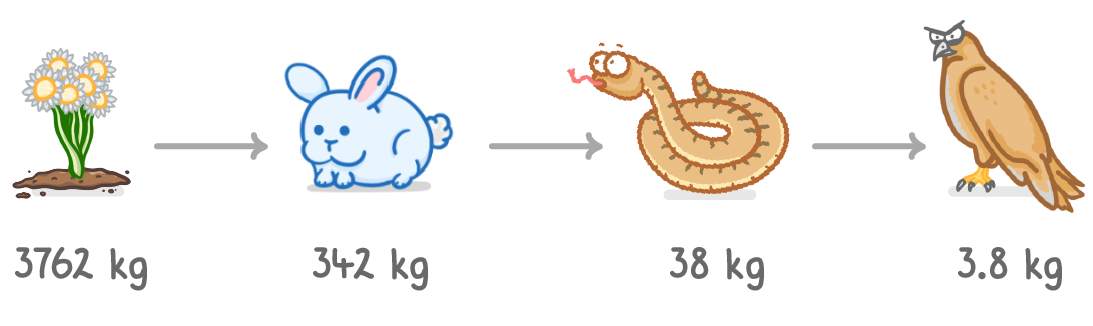
Calculate the efficiency of biomass transfer between trophic level 2, and trophic level 3. Round your answer to 1 decimal place.
12.1%
10.5%
13.0%
11.1%
|
Calculate the efficiency of biomass transfer between trophic level 3, and trophic level 4. Round your answer to 1 decimal place.
%
|
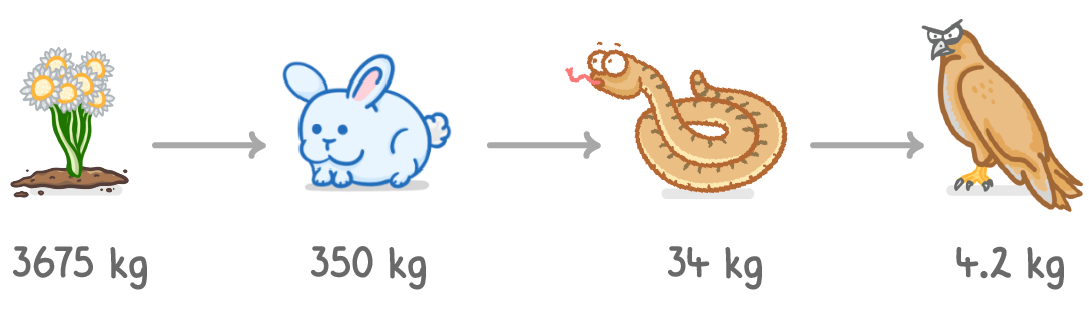
Calculate the efficiency of biomass transfer between trophic level 1, and trophic level 2. Round your answer to 1 decimal place.
%
|