Welcome to the Quiz!
This quiz contains 9 questions from a mix of 1 subtopics.
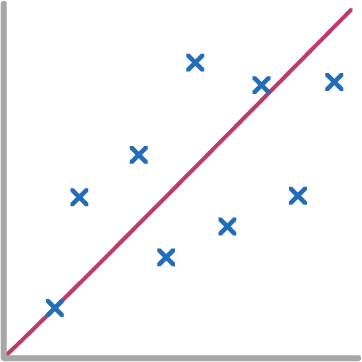
What type of correlation is shown by the scatter graph?
Strong positive
Weak negative
No correlation
Strong negative
Weak positive
|
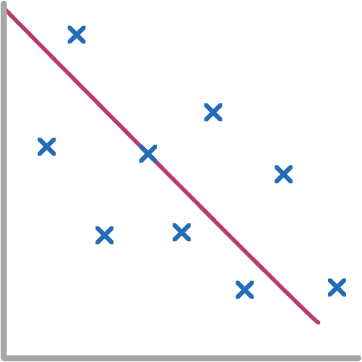
What type of correlation is shown by the scatter graph?
Strong negative
Weak positive
No correlation
Weak negative
Strong positive
|
What type of correlation is shown by the scatter graph?
Weak negative
Strong negative
No correlation
Strong positive
Weak positive
|
What type of correlation is shown by the scatter graph?
Weak negative
Weak positive
Strong positive
No correlation
Strong negative
|
The scatter graph shows some information about 8 cars. For each car is shows the engine size, in litres, and the distance, in kilometres, the car travels on one litre of petrol.
Estimate the distance travelled by a car with a 2.5 L engine size.
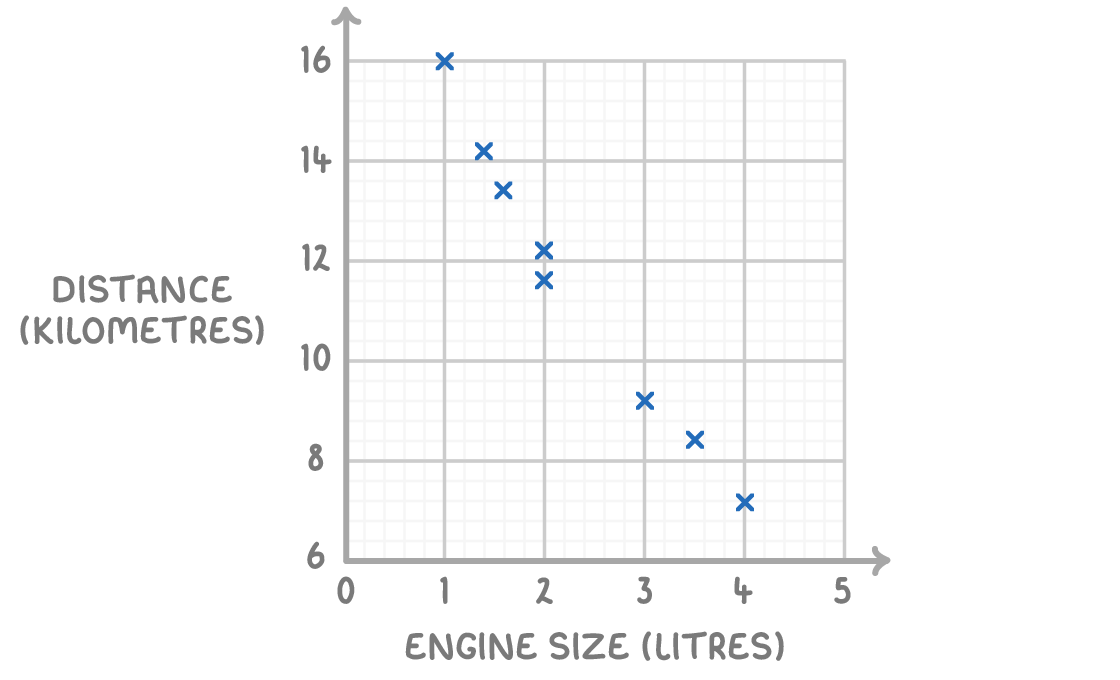
12 km
16 km
14 km
11 km
|
The scatter graph shows information about the test scores of some students in Maths and the number of hours they spend watching TV a day.
What type of correlation does the scatter graph show?
Weak negative
Strong negative
Weak positive
Strong positive
|
The average daytime temperature for 10 days is recorded. A shop also records its ice cream sales for each of the 110 days. The scatter graph shows this information.
Estimate the ice cream sales when the average temperature was 12°C.
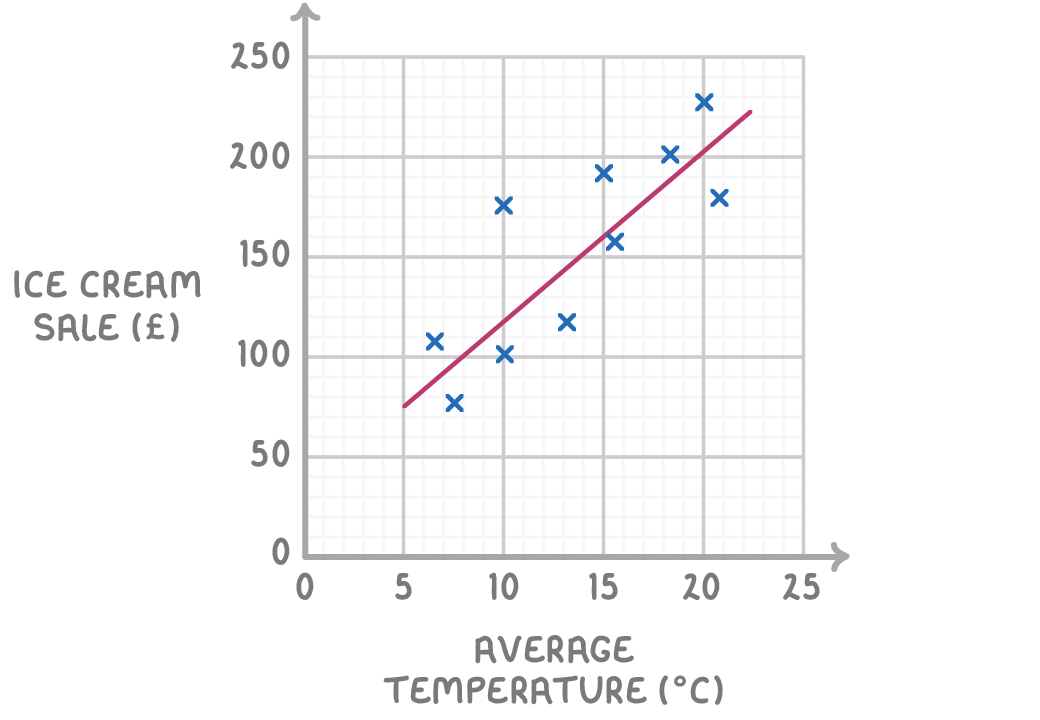
£101
£68
£135
£154
|
The scatter graph shows the scores of 15 students on their Biology and Physics tests.
One student scored 52 marks on their Biology test. Estimate the Physics score for this student.
36
62
54
80
|
Gary recorded how many goals 10 football teams scored. He also recorded how many goals they conceded. The information is shown on the scatter graph.
One team scored 44 goals. Estimate the number of goals this team has conceded.
30
40
50
35
|